STIR: RBA-Dated OIS Strip Calls Time On RBA Hiking Cycle (For Now)
Fallout from the SVB collapse leaves the RBA-dated OIS strip calling time on the RBA’s rate hiking cycle, with 1-2bp of easing now priced for next month’s central bank gathering, while a 25bp cut is now essentially fully priced for the Bank’s December meeting (RBA-dated OIS covering meetings from August currently all price more than a 50% chance of such a step).
- A softer NAB business confidence reading (moving into negative territory) will do nothing to push back against this pricing, given that the RBA included it on the list of must-watch data re: monetary policy assessment. The survey collator noted that “while we expect inflation likely peaked in Q4, price growth remains elevated and the survey suggests that while global goods-side pressures have abated somewhat, there has been less evidence of easing in services-side pressures. NAB continues to expect a more material slowdown in demand, but this will likely come later in 2023 when the full effect of rate rises has passed through.”
- U.S. CPI data (due Tuesday, NY Time) will be key for the short-term outlook of market pricing re: global monetary policy settings.
Fig. 1: RBA-Dated OIS Strip
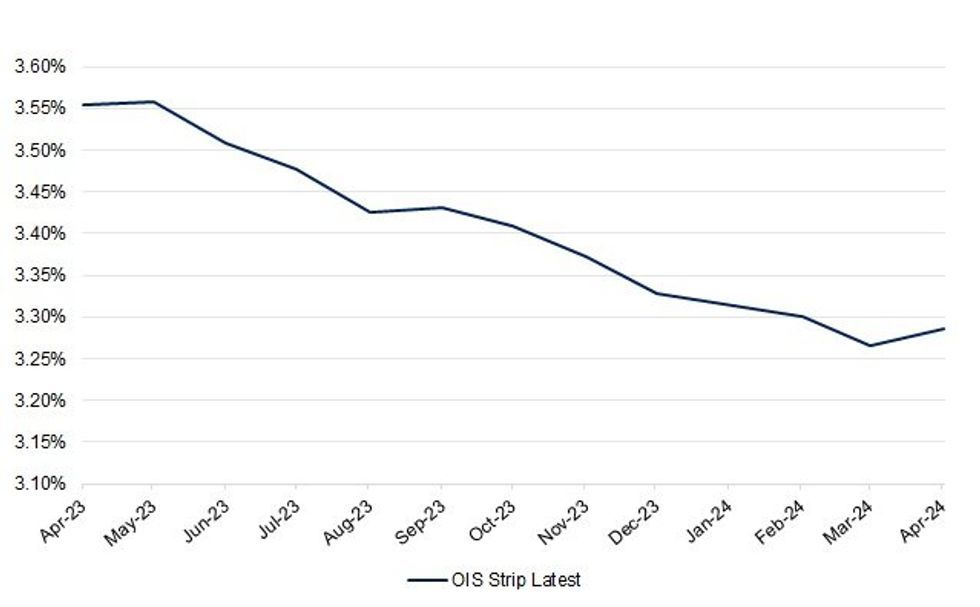
| OIS Strip Latest | |
| Apr-23 | 3.56% |
| May-23 | 3.56% |
| Jun-23 | 3.51% |
| Jul-23 | 3.48% |
| Aug-23 | 3.43% |
| Sep-23 | 3.43% |
| Oct-23 | 3.41% |
| Nov-23 | 3.37% |
| Dec-23 | 3.33% |
| Feb-24 | 3.30% |
| Mar-24 | 3.27% |
| Apr-24 | 3.29% |
Source: MNI - Market News/Bloomberg
Want to read more?
Find more articles and bullets on these widgets:
Historical bullets
USDCAD TECHS: Recent Gains Considered Corrective
- RES 4: 1.3751 High Nov 4
- RES 3: 1.3705 Dec 16 and the bull trigger
- RES 2: 1.3665 High Jan 6
- RES 1: 1.3475/3521 High Feb 6 / 19 and key short-term resistance
- PRICE: 1.3368 @ 17:04 GMT Feb 10
- SUP 1: 1.3345/3262 Low Feb 10 / 2
- SUP 2: 1.3226 Low Nov 15 and bear trigger
- SUP 3: 1.3205 61.8% retracement of the Aug 11 - Oct 13 rally
- SUP 4: 1.3131 0.764 proj of the Oct 13 - Nov 15 - Dec 16 price swing
USDCAD is consolidating and price remains above its recent low of 1.3262 on Feb 2. A bearish threat remains present and recent short-term gains are most likely a correction. A resumption of weakness and a break of 1.3262, Feb 2 low, would strengthen bearish conditions and open 1.3226, the Nov 15 low and the bear trigger. On the upside, the pair needs to clear 1.3521, the Jan 19 high, to signal a stronger reversal.
AUDUSD TECHS: Trend Needle Points North Despite Recent Pullback
- RES 4: 0.7245 2.00 proj of the Nov 21 - Dec 13 - Dec 20 price swing
- RES 3: 0.7202 High Jun 9
- RES 2: 0.7172 1.764 proj of the Nov 21 - Dec 13 - Dec 20 price swing
- RES 1: 0.7082/0.7158 High Feb 3 / 2 and the bull trigger
- PRICE: 0.6919 @ 16:59 GMT Feb 10
- SUP 1: 0.6856 Low Feb 6
- SUP 2: 0.6781 38.2% retracement of the Oct 13 - Feb 2 uptrend
- SUP 3: 0.6755 Trendline support drawn from the Oct 13 low
- SUP 4: 0.6688 Low Jan 3
AUDUSD is unchanged Friday. The uptrend remains intact, however, the recent move lower highlights a correction that is allowing a recent overbought trend condition to unwind. Price has pierced support at 0.6883, the 50-day EMA. A clear break of this EMA would signal scope for a deeper retracement. Key resistance and the bull trigger have been defined at 0.7158, the Feb 2 high. A break would resume the uptrend.


