INDONESIA: The Jakarta Composite Fall in Recent Context.
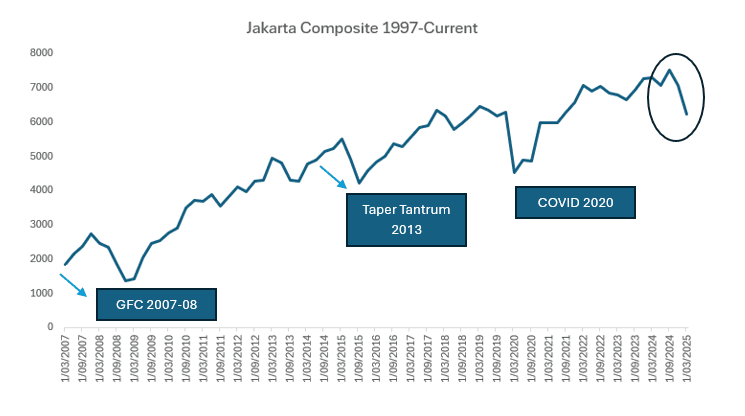
- GFC 2008 : the financial crisis of 2008 hit emerging economies hard as developed markets were faced with a crisis in the global financial sector. The Jakarta composite was not immune falling from its peak in December 2007 through to its trough in December 2008 by just over -50%.
In 2008 the Indonesian Rupiah depreciated c. 39%
- Taper Tantrum 2013: when Ben Bernanke (the then chairman of the Federal Reserve) hinted that they may taper the bond buying program, financial markets reacted negatively at the prospect which led to a surge in global volatility, causing investors to pull capital from these markets, leading to currency depreciation and rising yields. From the Fed’s May meeting when the language was introduced to the lows in August, the Jakarta Composite declined -23%. We also saw meaningful weakness in 2015 for local equities, in the lead up to the first Fed hike.
In 2013 the Indonesian Rupiah depreciated c. 26%.
- COVID Shutdown 2020: the world went into shutdown as a virus spread globally with many countries shutting their borders, decimating supply chains and seriously hurting export orientated economies. From it’s pre-COVID peak in January 2020, to the lows in March the Jakarta Composite fell -37%.
In 2020 the Indonesian Rupiah depreciated c. 22%
When President Trump was elected to the White House last year, he was done so on the mantra of protectionism underscored by tariffs. This has been a primary driver in the global economy since and as with any period of volatility, the USD strengthens. Since the US election the Indonesian Rupiah has depreciated c. 9%.
- Yesterday the Jakarta Composite finished -3.8% down, having been down by -6.8% earlier leading to a halt in market trading. However this is not a one off event. The Jakarta composite has been in a bearish trend since September, with a peak to trough decline in the Index of -21%.
The move in the Jakarta Composite (when compared to recent volatile periods) is not insignificant and is due to a range of factors including the looming trade war and Indonesia’s reliance on China trade. There are also fiscal concerns, with a recent delay in the budget data.
The well regarded finance minister Sri Indrawati came out yesterday and dispelled rumours of her resignation. Ms Indrawati is well regarded by global markets as a former Managing Director of the Word Bank.
This all comes as Bank Indonesia meets today to decide whether to move on interest rates. A cut could shake markets into thinking there is a broader, darker underlying theme yet equally a no change decision could be seen as not doing enough (see MNI BI Preview Here).
With very little key economic data out for the rest of the month it will ultimately fall on Bank Indonesia and its FX reserves as the likely source to calm markets in an economy otherwise forecast to grow 5.0% in 2025.
Want to read more?
Find more articles and bullets on these widgets:
Historical bullets
FOREX: Yen Outperforms Post Q4 GDP Beat, NZD Firmer
Yen is firmer, aided by the Q4 GDP beat, while AUD and NZD have ticked higher as well in early Monday dealings. The rest of the G10 aren't moving much (with SEK down modestly). The BBDXY index is little changed versus end Friday levels, last close to 1288.0.
- USD/JPY got to lows of 151.91 post the GDP print, and holds close to this level in latest dealings, up around 0.25% firmer in yen terms for the session. The Q4 GDP print continued to suggest a resilient growth backdrop, albeit with slower consumer spending. This will be a watch for the authorities, although Dec monthly data pointed to firmer real spending and wage outcomes. It should keep the BOJ on a further normalization path.
- If we can sustain a break sub 152.00, the Feb 7 low at 150.93 may come into focus.
- There is no cash US Tsy trading today, due to a US holiday. Tsy futures are softer in early dealings. The trend for US-JP yield differentials has been lower following recent US data misses.
- NZD/USD is back above 0.5730, with Friday highs near 0.5740 close by. Key levels to watch include, resistance is 0.5763 (Dec 18 highs), while 0.5790 (100-Day EMA) could become a target. Earlier data showed the services PMI rebounding back above 50.0 in Jan.
- AUD/USD is slightly trailing NZD, last near 0.6355/60. The AUD/NZD cross is back sub 1.1100. The RBA tomorrow and RBNZ on Wednesday are expected to ease.
- We have Japan data on Dec IP and the tertiary activity index later. Otherwise, the data/event risk calendar is largely empty for Asia Pac markets.
STIR: RBNZ Dated OIS Pricing Firmer Than Early Feb Levels Ahead Of RBNZ Decision
RBNZ dated OIS pricing is slightly softer across meetings today, ahead of the RBNZ Policy Decision on Wednesday.
- The RBNZ decision is widely expected to cut rates 50bp again to 3.75%. Revised staff forecasts will also be published with the decision at 1200 AEDT/1400 NZDT and Governor Orr’s press conference taking place at 1300 AEDT/1500 NZDT.
- All 22 analysts surveyed by Bloomberg are forecasting a 50bp rate cut and the RBNZ shadow board is recommending 50bp of easing.
- Notably, OIS pricing is 2–13bps firmer than pre-Q4 Labour Market data levels from February 4.
- Nevertheless, 49bps of easing is priced for Wednesday, with a cumulative 117bps by November 2025.
Figure 1: RBNZ Dated OIS Today vs. Pre-Q4 Labour Market Data (%)

Source: MNI – Market News / Bloomberg
ASIA STOCKS: Asia Sees Outflows Across The Region Last Week
Large outflows in Taiwan on Friday, as TSMC dropped 2.75%. India continues to see outflows as we now close in on almost $11b of outflows for the year. There wasn't a single region who saw inflows the past week.
- South Korea: Recorded -$87m in outflows on Friday, bringing the 5-day total to -$154m. YTD flows remain negative at -$1.37b. The 5-day average is -$31m, better than the 20-day average of -$76m but worse than the 100-day average of -$120m.
- Taiwan: Posted -$754m in outflows on Friday, bringing the 5-day total to -$1.09b. YTD flows remain negative at -$3.13b. The 5-day average is -$219m, slightly worse than the 20-day average of -$197m and significantly worse than the 100-day average of -$55m.
- India: Recorded -$253m in outflows on Thursday, bringing the 5-day total to -$1.60b. YTD outflows remain heavy at -$10.86b. The 5-day average is -$320m, close to the 20-day average of -$316m and worse than the 100-day average of -$205m.
- Indonesia: Posted -$36m in outflows on Friday, bringing the 5-day total to -$184m. YTD flows remain negative at -$646m. The 5-day average is -$37m, worse than the 20-day average of -$20m and the 100-day average of -$29m.
- Thailand: Saw +$24m in inflows on Friday, bringing the 5-day total to -$2m. YTD flows remain negative at -$289m. The 5-day average is $0m, better than the 20-day average of -$5m and the 100-day average of -$18m.
- Malaysia: Registered -$25m in outflows on Friday, bringing the 5-day total to -$25m. YTD flows are negative at -$785m. The 5-day average is -$5m, better than the 20-day average of -$26m but slightly worse than the 100-day average of -$27m.
- Philippines: Recorded -$10m in outflows on Friday, bringing the 5-day total to -$43m. YTD flows remain negative at -$129m. The 5-day average is -$9m, worse than the 20-day average of -$2m and the 100-day average of -$3m.
Table 1: EM Asia Equity Flows
