MNI DAILY TECHNICAL ANALYSIS - Stocks Complicate Tech Picture
Price Signal Summary – Stock Surge Complicates Tech Picture
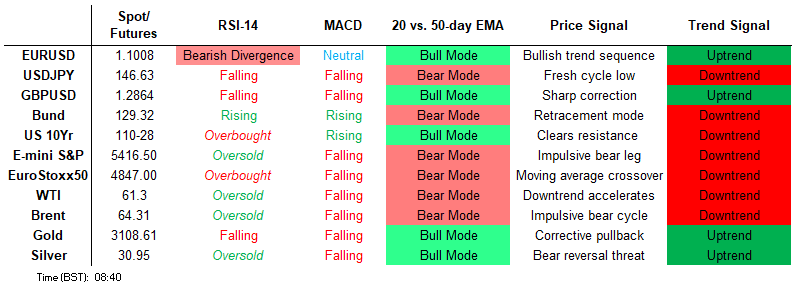
- A short-term reversal in S&P E-Minis yesterday highlights the start of what appears to be a corrective cycle. The trend condition has been oversold following recent weakness and the move higher is allowing this set-up to unwind. Eurostoxx 50 futures have traded in an extremely volatile manner and rallied sharply higher from this week’s lows. The climb highlights the start of a corrective cycle and if this is correct, marks an unwinding of the recent oversold trend condition.
- GBPUSD continues to recover from this week’s low. Recent weakness appears to be corrective. Price has traded below the 50-day EMA - a concern for bulls - however, moving average studies remain in a bull mode position and this highlights a dominant uptrend. Short-term gains in USDJPY are considered corrective. The recent break of 146.54, the Mar 11 low, confirms a resumption of the downtrend and maintains the price sequence of lower lows and lower highs. USDCAD the recent move higher appears to have been a correction. The trend condition remains bearish - the Apr 3 sell-off confirmed a resumption of the medium-term bear cycle that started Feb 3.
- The trend condition in Gold remains bullish and the latest pull back appears to have been a correction. Moving average studies are unchanged, they remain in a bull-mode position highlighting a dominant uptrend. A bearish theme in WTI futures remains intact and yesterday’s rally from the day low is - for now - considered corrective. The move higher is allowing an oversold trend condition to unwind. Recent weakness has resulted in the breach of a number of important support levels.
- Bund futures have traded in a volatile manner this week and remain below their recent highs. A bull cycle remains in play - for now - and the latest pullback is considered corrective. A fresh short-term cycle high on Monday reinforces a bullish theme. A sharp sell-off in the Gilt futures this week highlights a strong bearish theme. The contract has breached 90.55, the Mar 27 low. Clearance of this level confirms a full reversal of the Mar 27 - Apr 7 rally.
FOREIGN EXCHANGE
EURUSD TECHS: Trend Structure Remains Bullish
- RES 4: 1.1276 High Jul 18 ‘23
- RES 3: 1.1214 High Sep 25 2024 and a key resistance
- RES 2: 1.1188 0.764 proj of the Feb 28 - Mar 18 - 27 price swing
- RES 1: 1.1144 High Oct 1 2024 / High Apr 3 and the bull trigger
- PRICE: 1.0979 @ 05:45 BST Apr 10
- SUP 1: 1.0882 Low Apr 7
- SUP 2: 1.0854 20-day EMA
- SUP 3: 1.0733 Low Mar 27 and a key short-term support
- SUP 4: 1.0713 50-day EMA and a short-term pivot level
Despite the volatile price action, the trend condition in EURUSD is unchanged and remains bullish. The latest pullback is considered corrective. The recent breach of 1.0955, the Mar 18 high, confirms a resumption of the uptrend and maintains the price sequence of higher highs and higher lows. Sights are on 1.1188 next, a Fibonacci projection. Initial firm support lies at 1.0854, the 20-day EMA.
GBPUSD TECHS: Recovery From Monday’s Low Extends
- RES 4: 1.3274 High Oct 3 ‘24
- RES 3: 1.3207 High Apr 3 and the bull trigger
- RES 2: 1.3017 61.8% retracement of the Apr 3 - 7 sell-off
- RES 1: 1.2899 38.2% retracement of the Apr 3 - 7 sell-off
- PRICE: 1.2869 @ 06:34 BST Apr 10
- SUP 1: 1.2709 Low Apr 7
- SUP 2: 1.2654 50.0% retracement of the Jan 13 - Apr 3 bull cycle
- SUP 3: 1.2645 2.0% 10-dma envelope
- SUP 4: 1.2559 Low Feb 28
GBPUSD continues to recover from this week’s low. Recent weakness appears to be corrective. Price has traded below the 50-day EMA - a concern for bulls - however, moving average studies remain in a bull mode position and this highlights a dominant uptrend. An extension higher would open 1.2899 and 1.3017, Fibonacci retracement points. A move through Monday's 1.2709 low, would instead signal scope for a deeper retracement.
EURGBP TECHS: Monitoring Support
- RES 4: 0.8715 The Dec 28 ‘23 high
- RES 3: 0.8700 Round number resistance
- RES 2: 0.8683 1.764 proj of the Mar 3 - 11 - 28 price swing
- RES 1: 0.8663 High Apr 09
- PRICE: 0.8545 @ 07:08 BST Apr 10
- SUP 1: 0.8470/0.8427 Low Apr 7 / 20-day EMA
- SUP 2: 0.8384 50-day EMA
- SUP 3: 0.8316 Low Mar 28 and a key near-term support
- SUP 4: 0.8299 Low Mar 5
EURGBP pulled back sharply from Wednesday’s high. Weakness near-term, would be considered corrective and this would allow an overbought trend reading to unwind. Recent gains have reinforced a bullish theme and resumption of strength would signal scope for a climb towards 0.8683 next, a Fibonacci projection. On the downside, support to watch is 0.8470, the Apr 7 low. Support at the 20-day EMA is at 0.8427.
USDJPY TECHS: MA Studies Remain In A Bear-Mode Position
- RES 4: 151.30 High Mar 3
- RES 3: 150.06151.21 50-day EMA / High Mar 28 and reversal trigger
- RES 2: 148.64 20-day EMA
- RES 1: 148.27 High APr 9
- PRICE: 146.72 @ 06:52 BST Apr 10
- SUP 1: 144.00/143.43 Low Apr 9 and the bear trigger / Low Oct 2 ‘24
- SUP 2: 142.95 1.00 proj of the Feb 12 - Mar 11 - 28 price swing
- SUP 3: 141.65 Low Sep 30 ‘24
- SUP 4: 141.00 1.236 proj of the Feb 12 - Mar 11 - 28 price swing
Short-term gains in USDJPY are considered corrective. The recent break of 146.54, the Mar 11 low, confirms a resumption of the downtrend and maintains the price sequence of lower lows and lower highs. Note too that moving average studies are in a bear-mode position highlighting a dominant downtrend. A resumption of the downtrend would open 142.95, a Fibonacci projection. Initial firm resistance to watch is 148.64, the 20-day EMA.
EURJPY TECHS: Trend Outlook Remains Bullish
- RES 4: 165.43 High Nov 8
- RES 3: 164.90 High Dec 30 ‘24 and a key medium-term resistance
- RES 2: 164.55 High Jan 7
- RES 1: 162.37/164.19 High Apr 7 / High Mar 18 and the bull trigger
- PRICE: 161.15 @ 07:30 GMT Apr 10
- SUP 1: 158.30 Low Apr 7
- SUP 2: 157.02 76.4% retracement of the Feb 28 - Mar 18 bull cycle
- SUP 3: 155.60 Low Low Mar 4
- SUP 4: 154.80 Low Low Feb 28
Recent weakness in EURJPY still appears corrective and the strong rally from Monday’s low reinforces a bullish theme. Key short-term support has been defined at 158.30, the Apr 7 low. A break of this level is required to signal scope for a deeper retracement. This would open 157.02, a Fibonacci retracement. For bulls, a stronger resumption of gains would expose 164.19, the Mar 18 high and the bull trigger.
AUDUSD TECHS: Approaching An Important Resistance Zone
- RES 4: 0.6409 High Dec 9 and a key resistance
- RES 3: 0.6389 High Apr 3
- RES 2: 0.6265 50-day EMA
- RES 1: 0.6214 20-day EMA
- PRICE: 0.6191 @ 07:58 BST Apr 10
- SUP 1: 0.6088/0.5915 Low Feb 3 / Low Apr 9 and the bear trigger
- SUP 2: 0.5900 Round number support
- SUP 3: 0.5830 2.000 proj of the Sep 30 - Nov 6 - 7 price swing
- SUP 4: 0.5729 2.236 proj of the Sep 30 - Nov 6 - 7 price swing
A strong rally in AUDUSD Wednesday has defined a key support and bear trigger at 0.5915, the Apr 9 low. Resistance levels to watch are; 0.6214, the 20-day EMA, and 0.6265, the 50-day EMA. A clear break of this resistance zone would highlight a stronger reversal and signal scope for a continuation higher. For bears, a resumption of weakness would refocus attention on the 0.8415 bear trigger.
USDCAD TECHS: Trading Below Resistance
- RES 4: 1.4452/4543 High Mar 13 / 4 and a bull trigger
- RES 3: 1.4415 High Apr 1
- RES 2: 1.4292 50-day EMA
- RES 1: 1.4144 Low Apr 8
- PRICE: 1.4056 @ 08:07 BST Apr 10
- SUP 1: 1.4028 Low Apr 3 and the bear trigger
- SUP 2: 1.3986 Low Dec 2 ‘24
- SUP 3: 1.3944 61.8% retracement of Sep 25 ‘24 - Feb 3 bull run
- SUP 4: 1.3894 Low Nov 11 ‘24
USDCAD the recent move higher appears to have been a correction. The trend condition remains bearish - the Apr 3 sell-off confirmed a resumption of the medium-term bear cycle that started Feb 3. Price has traded through a key support at 1.4151, the Feb 14 low, and this signals scope for an extension towards 1.3944, a Fibonacci retracement. On the upside, key short-term resistance is seen at 1.4292, the 50-day EMA.
FIXED INCOME
BUND TECHS: (M5) Pullback Considered Corrective
- RES 4: 132.56 High Feb 28 and a key resistance
- RES 3: 132.03 High Apr 7 and the bull trigger
- RES 2: 131.32 76.4% retracement of Apr 7 - 9 pullback
- RES 1: 130.32 50.0% retracement of Apr 7 - 9 pullback
- PRICE: 129.52 @ 05:25 BST Apr 10
- SUP 1: 128.60 Low Apr 9
- SUP 2: 128.47 Low Mar 28
- SUP 3: 127.74 Low Mar 25 and a key short-term support
- SUP 4: 127.20 Low Mar 17
Bund futures have traded in a volatile manner this week and remain below their recent highs. A bull cycle remains in play - for now - and the latest pullback is considered corrective. A fresh short-term cycle high on Monday reinforces a bullish theme. The contract has recently cleared 131.14, 76.4% of the Feb 28 - Mar 11 bear leg. This opens 132.56, the Feb 28 high. Initial firm support lies at 128.60, Wednesday’s low.
BOBL TECHS: (M5) Corrective Volatile Pullback
- RES 4: 120.000 Psychological round number
- RES 3: 119.960 High Apr 7 and the bull trigger
- RES 2: 119.422 76.4% retracement of Apr 7 - 9 pullback
- RES 1: 118.820 50.0% retracement of Apr 7 - 9 pullback
- PRICE: 118.190 @ 06:15 BST Apr 10
- SUP 1: 117.680 Low Apr 9 / 1
- SUP 2: 117.410 Low Mar 27
- SUP 3: 117.126 76.4% retracement of the Mar 6 - Apr 7 bull cycle
- SUP 4: 117.080 Low Mar 25 and a key short-term support
Bobl futures have pulled back sharply from their recent highs. The move down - for now, appears corrective. Last week’s gains resulted in a break of key resistance at 119.040, the Feb 28 high. This strengthens bullish conditions and signals scope for a continuation. The focus is on the 120.000 handle next. The contract is overbought, a move down is allowing this condition to unwind. Initial firm support lies at 117.680, the Apr 9 low.
SCHATZ TECHS: (M5) Volatile Correction
- RES 4: 107.800 Round number resistance
- RES 3: 107.775 High Apr 7 and the bull trigger
- RES 2: 107.466 61.8% retracement of the Apr 7 - 9 pullback
- RES 1: 107.274 38.2% retracement of the Apr 7 - 9 pullback
- PRICE: 107.140 @ 07:04 BST Apr 10
- SUP 1: 106.965 Low Apr 9
- SUP 2: 106.830 Low Mar 27
- SUP 3: 106.728 76.4% retracement of the Mar 6 - Apr 7 bull cycle
- SUP 4: 106.630 Low Mar 18
Schatz futures have pulled back sharply from this week’s high and the contract is trading in a volatile manner. For now, the move down appears corrective. Price has recently traded through a key resistance at 107.120, the Mar 4 high. The break highlights a stronger bull cycle and signals scope for a climb towards 107.800. Initial firm support to watch lies at 106.965, yesterday’s low.
GILT TECHS: (M5) Clears Support
- RES 4: 94.50 High Apr 7 and key resistance
- RES 3: 93.00 Round number resistance
- RES 2: 92.63 High Apr 8
- RES 1: 91.99 20-day EMA
- PRICE: 91.04 @ 08:11 BST Apr 10
- SUP 1: 89.99 Low Apr 9
- SUP 2: 89.68 Low Jan 15 (cont)
- SUP 3: 88.96 Low Jan 13 and a key support
- SUP 4: 88.00 Round number support
A sharp sell-off in the Gilt futures this week highlights a strong bearish theme. The contract has breached 90.55, the Mar 27 low. Clearance of this level confirms a full reversal of the Mar 27 - Apr 7 rally. Sights are on the 90.00 handle next, briefly pierced yesterday. A clear break of this level would signal scope for an extension towards a key support at 88.96, the Jan 13 low on the continuation chart. Initial resistance is at 91.99, the 20-day EMA.
BTP TECHS: (M5) Bear Threat Remains Present
- RES 4: 120.12 High High Mar 4
- RES 3: 119.31 Low Mar 4 and a gap high on the daily chart
- RES 2: 118.26/119.07 High Apr 8 / 4 and the bull trigger
- RES 1: 117.71 20-day EMA
- PRICE: 117.52 @ 07:10 BST Apr 10
- SUP 1: 116.06 Low Apr 9 and the bear trigger
- SUP 2: 115.75 Low Mar 14 and the bear trigger
- SUP 3: 115.53 0.764 proj of the Feb 28 - Mar 14 - Apr 4 price swing
- SUP 4: 115.00 Round number support
BTP futures rallied sharply higher from Wednesday’s low. This week’s move down confirmed a reversal of the Mar 14 - Apr 4 bull cycle. The move down exposes key support at 115.75, the Mar 14 low and a bear trigger. A break of this level would confirm a resumption of the medium-term downtrend. On the upside, initial firm resistance to monitor is 117.71, the 20-day EMA. A clear break of this level would potentially undermine the bearish theme.
EQUITIES
EUROSTOXX50 TECHS: (M5) Unwinding An Oversold Trend Condition
- RES 4: 5341.00 High Mar 27
- RES 3: 5187.43 50-day EMA
- RES 2: 5088.65 20-day EMA
- RES 1: 5001.00 High Apr 9
- PRICE: 4507.00 @ 06:11 BST Apr 9
- SUP 1: 4788.23 38.2% retracement of the Apr 7 - 9 bounce
- SUP 2: 4656.77 61.8% retracement of the Apr 7 - 9 bounce
- SUP 3: 4444.00 - Low Apr 7
- SUP 4: 4336.00 - Low Nov 28 ‘23 (cont)
Eurostoxx 50 futures have traded in an extremely volatile manner and rallied sharply higher from this week’s lows. The climb highlights the start of a corrective cycle and if this is correct, marks an unwinding of the recent oversold trend condition. Resistance levels to watch are 5088.65, the 20-day EMA, and 5187.43, the 50-day EMA. Key support and the bear trigger has been defined at 4444.00, the Apr 7 low.
E-MINI S&P: (M5) Corrective Cycle
- RES 4: 5906.75 High Mar 6
- RES 3: 5837.25 High Mar 25 and the reversal trigger
- RES 2: 5755.62 50-day EMA
- RES 1: 5548.37 20-day EMA
- PRICE: 5455.25 @ 05:57 BST Apr 10
- SUP 1: 5185.17 50.0% retracement of the Apr 7 - 10 bounce
- SUP 2: 4832.00 Low Apr 7 and the bear trigger
- SUP 3: 4760.88 1.618 proj of the Feb 19 - Mar 13 - 25 price swing
- SUP 4: 4663.75 1.764 proj of the Feb 19 - Mar 13 - 25 price swing
A short-term reversal in S&P E-Minis yesterday highlights the start of what appears to be a corrective cycle. The trend condition has been oversold following recent weakness and the move higher is allowing this set-up to unwind. Initial resistance to watch is 5548.37, the 20-day EMA. Resistance at the 50-day EMA is at 5755.62. On the downside, key support and the bear trigger has been defined at 4832.00, the Apr 7 low.
COMMODITIES
BRENT TECHS: (M5) Trend Structure Remains Bearish
- RES 4: $77.75 - High Jan 20
- RES 3: $76.26 - High Feb 20
- RES 2: $71.39/75.47 - 50-day EMA / High Apr 2 and a bull trigger
- RES 1: $67.95 - Low Mar 5
- PRICE: $64.81 @ 06:14 BST Apr 10
- SUP 1: $58.40 - Low Apr 9
- SUP 2: $58.85 - 2.000 proj of the Feb 20 - Mar 5 - Apr 2 price swing
- SUP 3: $56.89 - 2.236 proj of the Feb 20 - Mar 5 - Apr 2 price swing
- SUP 4: $55.00 - Round number support
Brent futures have rallied from yesterday’s low. For now, the move higher is considered corrective and this is allowing a recent oversold condition to unwind. The primary trend direction remains down and a resumption of weakness would open $56.89, a Fibonacci projection. On the upside, initial firm resistance is seen at $67.95, the Mar 5 low. Resistance at the 20-day EMA, is at $71.39, the 50-day EMA.
WTI TECHS: (K5) Resistance Remains Intact
- RES 4: $74.66 - High Jan 22
- RES 3: $72.91 - High Feb 11
- RES 2: $68.12/72.28 - 50-day EMA / High Apr 2 and key resistance
- RES 1: $64.85 Low Mar 5 low and a recent breakout level.
- PRICE: $61.80 @ 06:49 BST Apr 10
- SUP 1: $55.12 - Low Apr 9
- SUP 2: $54.26 - 2.236 proj of the Feb 11 - Mar 5 - Apr 2 price swing
- SUP 3: $56.81 - 2.382 proj of the Jan 15 - Feb 4 - 11 price swing
- SUP 4: $50.00 - Psychological round number
A bearish theme in WTI futures remains intact and yesterday’s rally from the day low is - for now - considered corrective. The move higher is allowing an oversold trend condition to unwind. Recent weakness has resulted in the breach of a number of important support levels, reinforcing a bearish threat. A resumption of weakness would open $54.26, a Fibonacci projection. Initial firm resistance is seen at $64.85, the Mar 5 low and a recent breakout level.
GOLD TECHS: Trend Needle Points North
- RES 4: $3223.8 - 3.382 proj of the Nov 14 - Dec 12 - 19 price swing
- RES 3: $3200.00 - Round number resistance
- RES 2: $3196.2 - 3.236 proj of the Nov 14 - Dec 12 - 19 price swing
- RES 1: $3167.8 - High Apr 3 and bull trigger
- PRICE: $3118.9 @ 06:38 BST Apr 10
- SUP 1: $3031.3 - 20-day EMA
- SUP 2: $2956.7/2952.2 - Low Apr 7 / 50-day EMA
- SUP 3: $2880.3 - Low Mar 10
- SUP 4: $2832.7 - Low Feb 28
The trend condition in Gold remains bullish and the latest pull back appears to have been a correction. Moving average studies are unchanged, they remain in a bull-mode position highlighting a dominant uptrend. The next key support to watch lies at 2952.2, the 50-day EMA. A resumption of gains would refocus attention on $3196.2, a Fibonacci projection. The bull trigger is 3167.8, the Apr 3 high.
SILVER TECHS: Rally Considered Corrective
- RES 4: $34.903 - High Oct 23 ‘24 and the bull trigger
- RES 3: $34.590 - High Mar 28
- RES 2: $32.244 - 50-day EMA
- RES 1: $31.312 - Intraday low
- PRICE: $31.148 @ 08:14 BST Apr 10
- SUP 1: $28.351 - Low Apr 7 and the bear trigger
- SUP 2: $27.686 - Low Sep 6 ‘24
- SUP 3: $27.180 - Low Aug 14 ‘24
- SUP 4: $26.451 - Low Aug 8 ‘24 and a key support
Silver continues to trade in a volatile manner and the metal has recovered from its recent lows. For now, the move higher appears corrective. The metal on Monday, traded through support at $28.748, the Dec 19 low. A clear break of this level would signal scope for a continued sell-off, towards $32.244 the 50-day EMA. A clear break of this average would alter the picture and highlight a stronger reversal.