MNI DAILY TECHNICAL ANALYSIS - USD/CAD Nears First Support
Price Signal Summary – USD/CAD Pullback Nears First Support
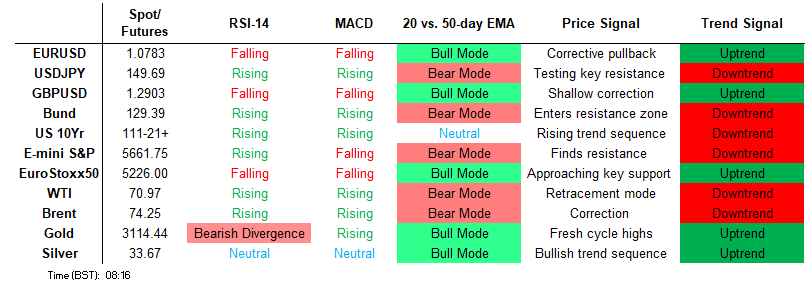
- S&P E-Minis maintain a softer tone following recent bearish price action. Sights are on key support and the bear trigger at 5559.75, the Mar 13 low. It has been pierced, a clear break of it would confirm a resumption of the downtrend that started Feb 19, and open 5483.30. Eurostoxx 50 futures traded lower Monday resulting in a breach of key support at 5229.00, the Mar 11 low. The contract has recovered, however, the print below 5229.00 undermines a bullish theme and signals scope for a deeper retracement.
- GBPUSD is in consolidation mode and trading in a range. Importantly for bulls, the pair continues to trade closer to its recent highs. MA studies are in a bull-mode position highlighting a dominant uptrend. Near-term resistance in USDJPY remains intact. The primary trend direction is unchanged, it remains down and the latest recovery is considered corrective. USDCAD traded sharply lower Tuesday. Attention is on an important short-term support at 1.4235, the Mar 26 low. A clear break of this level would undermine the bull theme and highlight potential for a test of 1.4151, the Feb 14 low and a bear trigger.
- The trend condition in Gold is unchanged, it remains bullish. The latest rally reinforces current conditions and confirms a continuation of the primary uptrend. The rally also once again, highlights fresh all-time highs for the yellow metal. WTI futures traded sharply higher Monday. This undermines the medium-term bearish condition and instead signals scope for a continuation higher near-term. The rally has exposed the next key resistance at $72.91, the Feb 11 high.
- Bund futures are trading closer to their recent highs. The latest recovery is considered corrective, however, the breach of the 20-day EMA and a print above resistance at 129.41, the Jan 14 low, strengthens a bullish theme and opens the 130.00 handle. The short-term trend outlook in Gilt futures remains bearish, however, recent gains highlight a corrective cycle and this signals scope for a stronger recovery near-term.
FOREIGN EXCHANGE
EURUSD TECHS: Corrective Cycle
- RES 4: 1.1083 High Oct 2 2024
- RES 3: 1.1040 High Oct 4 2024
- RES 2: 1.0961 76.4% retracement of the Sep 25 ‘24 - Feb 3 bear leg
- RES 1: 1.0861/0955 High Mar 21 / 18 and the bull trigger
- PRICE: 1.0788 @ 06:07 BST Apr 2
- SUP 1: 1.0733 Low Mar 27 and a key short-term support
- SUP 2: 1.0661 50-day EMA and a short-term pivot level
- SUP 3: 1.0602 Low Mar 5
- SUP 4: 1.0548 50.0% retracement of the Feb 3 - Mar 18 bull run
EURUSD is unchanged. A bullish theme remains intact and recent weakness appears corrective. Moving average studies are in a bull-mode position highlighting a dominant uptrend. Key near-term support lies at 1.0733, the Mar 27 low. A move through it would confirm a clear breach of the 20-day EMA and signal scope for a deeper correction towards the 50-day EMA at 1.0661. Key resistance and the bull trigger is 1.0955, the Mar 18 high.
GBPUSD TECHS: Bullish Trend Structure
- RES 4: 1.3175 High Oct 4 2024
- RES 3: 1.3119 76.4% retracement of the Sep 26 ‘24 - Jan 13 bear leg
- RES 2: 1.3048 High Nov 6 ‘24
- RES 1: 1.3015 High Mar 20 and the bull trigger
- PRICE: 1.2914 @ 06:19 BST Apr 2
- SUP 1: 1.2891/71 20-day EMA / Low Mar 27
- SUP 2: 1.2766 50-day EMA and a short-term pivot support
- SUP 3: 1.2679 Low Mar 4
- SUP 4: 1.2559 Low Feb 28
GBPUSD is in consolidation mode and trading in a range. Importantly for bulls, the pair continues to trade closer to its recent highs. MA studies are in a bull-mode position highlighting a dominant uptrend. A breach of 1.3015, the Mar 20 high and bull trigger, would resume the uptrend and open 1.3048, the Nov 6 2024 high. Support at the 20-day EMA, at 1.2891, is intact. A clear break of the 20-day EMA is required to signal scope for a deeper correction.
EURGBP TECHS: Trading Above Support
- RES 4: 0.8494 High Aug 26 ‘24
- RES 3: 0.8474 High Jan 20 and a key resistance
- RES 2: 0.8428/8450 High Mar 18 / 11 and the bull trigger
- RES 1: 0.8395 High Mar 24 and a key near-term resistance
- PRICE: 0.8355 @ 06:32 BST Apr 2
- SUP 1: 0.8316 Low Mar 28 and a key near-term support
- SUP 2: 0.8291 76.4% retracement of the Mar 3 - 11 bull leg
- SUP 3: 0.8251 Low Mar 4
- SUP 4: 0.8241 Low Mar 3 and a bear trigger
EURGBP is trading above last week’s low. The bear leg that started Mar 11 appears corrective and has allowed an overbought condition to unwind. MA studies are in a bull-mode position, highlighting a dominant uptrend. Support to watch is 0.8316, the Mar 28 low. A break of this level would signal scope for a deeper retracement and open 0.8290, a Fibonacci retracement. For bulls, clearance of 0.8395, the Mar 24 high, would be a bullish development.
USDJPY TECHS: Key Resistance Intact For Now
- RES 4: 152.70 50.0% retracement of the Jan 10 - Mar 11 bear leg
- RES 3: 151.30 High Mar 3
- RES 2: 150.82/151.21 50-day EMA / High Mar 28
- RES 1: 150.27 High Mar 31
- PRICE: 149.85 @ 06:52 BST Apr 2
- SUP 1: 148.70 Low Mar 31
- SUP 2: 148.18 Low Mar 20 and a key short-term support
- SUP 3: 147.42 Low Mar 13
- SUP 4: 146.54 Low Mar 11 nad the bear trigger
Near-term resistance in USDJPY remains intact. The primary trend direction is unchanged, it remains down and the latest recovery is considered corrective. Key resistance is unchanged, around the 50-day EMA, at 150.82. A clear break of this EMA would undermine the bearish theme and signal scope for a stronger rally towards 152.70, a Fibonacci retracement. The first key support to watch is 148.18, the Mar 20 low. A breach would be bearish.
EURJPY TECHS: Trend Needle Points North
- RES 4: 165.43 High Nov 8
- RES 3: 164.90 High Dec 30 ‘24 and a key medium-term resistance
- RES 2: 164.55 High Jan 7
- RES 1: 164.19 High Mar 18 and the bull trigger
- PRICE: 161.69 @ 07:11 GMT Apr 2
- SUP 1: 160.78 Low Apr 1 pivot support and the 50-day EMA
- SUP 2: 160.06 Low Mar 13
- SUP 3: 158.90 Low Mar 10
- SUP 4: 158.00 Round number support
The trend structure in EURJPY remains bullish and recent weakness appears corrective. The pullback has allowed an overbought condition to unwind. Pivot support is 160.75, the 50-day EMA. A break of it would signal potential for a deeper retracement. For bulls, attention is on 164.08, the Jan 24 high. It has been pierced, a clear break of this hurdle would strengthen a bullish condition and open 164.90, the Dec 30 ‘24 high.
AUDUSD TECHS: Support Remains Intact
- RES 4: 0.6429 High Dec 12 ‘24
- RES 3: 0.6414 38.2% retracement of the Sep 30 ‘24 - Feb 3 bear leg
- RES 2: 0.6409 High Feb 21 and a bull trigger
- RES 1: 0.6331/91 High Mar 26 / High Mar 17 and 18
- PRICE: 0.6294 @ 07:50 BST Apr 2
- SUP 1: 0.6219 Low Mar 31
- SUP 2: 0.6187 Low Feb 4
- SUP 3: 0.6171/6088 Low Feb 4 / 3 and a key support
- SUP 4: 0.6045 1.500 proj of the Sep 30 - Nov 6 - 7 price swing
AUDUSD has recovered from Monday’s 0.6219 low. This affirms the view that recent weakness is likely corrective, with prices still clear of Feb 4 support at 0.6187. A move through 0.6187 is required to reinstate a bear threat. On the upside, a stronger recovery would refocus attention on 0.6409, the Feb 21 high and a key resistance. Clearance of this hurdle would strengthen the bull cycle and resume the uptrend that started Feb 3.
USDCAD TECHS: Monitoring Support
- RES 4: 1.4700 Round number resistance
- RES 3: 1.4641 76.4% retracement of the Feb 3 - 14 bear leg
- RES 2: 1.4452/4543 High Mar 13 / 4 and a bull trigger
- RES 1: 1.4415 High Apr 1
- PRICE: 1.4303 @ 07:55 BST Apr 2
- SUP 1: 1.4235 Low Mar 26
- SUP 2: 1.4151 Low Feb 14 and a bear trigger
- SUP 3: 1.4107 50.0% retracement of Sep 25 ‘24 - Feb 3 bull run
- SUP 4: 1.4011 Low Dec 5 ‘24
USDCAD traded sharply lower Tuesday. Attention is on an important short-term support at 1.4235, the Mar 26 low. A clear break of this level would undermine the bull theme and highlight potential for a test of 1.4151, the Feb 14 low and a bear trigger. Note that moving average studies continue to highlight a dominant uptrend. A resumption of gains would refocus attention on the bull trigger at 1.4543, the Mar 4 high.
FIXED INCOME
BUND TECHS: (M5) Holding On To Its Recent Gains
- RES 4: 130.40 Low Feb 19
- RES 3: 130.26 61.8% retracement of the Feb 28 - Mar 11 bear leg
- RES 2: 130.00 Round number resistance
- RES 1: 129.60 High Apr 1
- PRICE: 129.15 @ 05:45 BST Apr 2
- SUP 1: 128.47 Low Mar 28
- SUP 2: 127.74 Low Mar 25 and a key short-term support
- SUP 3: 127.20 Low Mar 17
- SUP 4: 126.53 Low Mar 11 and the bear trigger
Bund futures are trading closer to their recent highs. The latest recovery is considered corrective, however, the breach of the 20-day EMA and a print above resistance at 129.41, the Jan 14 low, strengthens a bullish theme and opens the 130.00 handle and 130.26, a Fibonacci retracement. Key short-term support to watch lies at 127.74, the Mar 25 low. Clearance of this level would highlight a reversal.
BOBL TECHS: (M5) Bull Cycle Remains In Play
- RES 4: 119.040 High Feb 28 and a key resistance
- RES 3: 118.950 High Mar 4
- RES 2: 118.382 76.4% retracement of the Feb 28 - Mar 6 sell-off
- RES 1: 118.200 High Mar 31
- PRICE: 117.870 @ 05:51 BST Apr 2
- SUP 1: 117.519 20-day EMA
- SUP 2: 117.080 Low Mar 25 and a ey short-term support
- SUP 3: 116.800 Low Mar 17
- SUP 4: 116.470 Low Mar 12
Bobl futures traded to a fresh short-term cycle high Monday. The contract has breached 117.974, the 61.8% retracement of the bear leg between Feb 28 - Mar 6. The break strengthens the current bull cycle and paves the way for a climb towards 118.382, a Fibonacci retracement. On the downside, initial support to watch lies at 117.519, the 20-day EMA. Key short-term support is at 117.080, the Mar 25 low.
SCHATZ TECHS: (M5) Sights Are On Key Resistance
- RES 4: 107.289 1.236 retracement proj of the Mar 4 - 6 bear leg
- RES 3: 107.200 Round number resistance
- RES 2: 107.120 High Mar 4 and key resistance
- RES 1: 107.090 High Mar 31
- PRICE: 106.970 @ 06:03 BST Apr 2
- SUP 1: 106.900 Low Mar 31
- SUP 2: 106.816 20-day EMA
- SUP 3: 106.715 Low Mar 25
- SUP 4: 106.630 Low Mar 18
Schatz futures maintain a firmer tone despite the pullback from Monday’s high. Price has cleared all the relevant retracement levels of the bear leg between Mar 4 - 6, and this signals scope for a climb towards key resistance and a bull trigger at 107.120, the Mar 4 high. On the downside, initial firm support to watch lies 106.816, the 20-day EMA. A move down and a breach of this level would signal a possible reversal.
GILT TECHS: (M5) Corrective Cycle
- RES 4: 93.79 High Mar 4
- RES 3: 93.01 High Mar 20
- RES 2: 92.55 61.8% retracement of the Apr 4 - 27 bear leg
- RES 1: 92.42 Trendline resistance drawn from the Mar 4 high
- PRICE: 92.08 @ Close BST Apr 1
- SUP 1: 91.59 Low Mar 31
- SUP 2: 91.03 Low Mar 28
- SUP 3: 90.55 Low Mar 27 and the bear trigger
- SUP 4: 90.49 1.618 proj of the Feb 6 - 20 - Mar 4 price swing
The short-term trend outlook in Gilt futures remains bearish, however, recent gains highlight a corrective cycle and this signals scope for a stronger recovery near-term. An extension would open 92.42, a trendline resistance drawn from the Mar 4 high. Clearance of this level would strengthen the short-term bull cycle. Key support and the bear trigger has been defined at 90.55, the Mar 27 low.
BTP TECHS: (M5) Bull Phase Remains In Play
- RES 4: 120.39 High Feb 28 and a key resistance
- RES 3: 119.31 Low Mar 4 and a gap high on the daily chart
- RES 2: 118.62 76.4% retracement of the Feb 28 - Mar 14 bear leg
- RES 1: 118.37 High Apr 1
- PRICE: 118.13 @ Close Apr 1
- SUP 1: 117.45 20-day EMA
- SUP 2: 116.89 Low Mar 25 and a key short-term support
- SUP 3: 116.15 Low Mar 17
- SUP 4: 115.75 Low Mar 14
Recent gains in BTP futures still appear corrective in nature. However, the contract traded higher again yesterday and maintains a firmer short-term tone. A continuation of the current short-term bull phase would signal scope for an extension towards 118.62, a Fibonacci retracement. On the downside, key near-term support is at 116.89, the Mar 25 low. Clearance of this level would signal a reversal and the end of the corrective cycle.
EQUITIES
EUROSTOXX50 TECHS: (M5) Bear Threat Remains Present
- RES 4: 5600.00 Round number resistance
- RES 3: 5516.00 High Mar 3 and the bull trigger
- RES 2: 5471.00 High Mar 19 / 20
- RES 1: 5290.00/5335.34 50- and 20-day EMA values
- PRICE: 5250.00 @ 06:31 BST Apr 2
- SUP 1: 5157.00 Low Mar 31
- SUP 2: 5116.27 1.236 proj of the Mar 3 - 11 - 19 price swing
- SUP 3: 5079.00 Low Feb 3 and a key support
- SUP 4: 5040.00 Low Jan 16
Eurostoxx 50 futures traded lower Monday resulting in a breach of key support at 5229.00, the Mar 11 low. The contract has recovered, however, the print below 5229.00 undermines a bullish theme and signals scope for a deeper retracement. The 5200 handle has also been cleared, opening 5079.00, the Feb 3 low. It is still possible that recent weakness is part of a broader correction. Initial firm resistance is 5335.34, the 20-day EMA.
E-MINI S&P: (M5) MA Studies Highlight A Dominant Downtrend
- RES 4: 5878.53 50-day EMA
- RES 3: 5837.25 High Mar 25 and a key resistance
- RES 2: 5757.95 20-day EMA
- RES 1: 5694.75 High Apr 1
- PRICE: 5670.25 @ 07:21 BST Apr 2
- SUP 1: 5559.75/33.75 Low Mar 13 and the bear trigger / Low Mar 31
- SUP 2: 5500.00 Round number support
- SUP 3: 5483.50 2.00 proj of the Dec 6 ‘24 - Jan 13 - Feb 19 swing
- SUP 4: 5396.00 2.236 proj of the Dec 6 ‘24 - Jan 13 - Feb 19 swing
S&P E-Minis maintain a softer tone following recent bearish price action. Sights are on key support and the bear trigger at 5559.75, the Mar 13 low. It has been pierced, a clear break of it would confirm a resumption of the downtrend that started Feb 19, and open 5483.30, a Fibonacci projection. MA studies are in a bear-mode position, highlighting a dominant downtrend. Key short-term resistance has been defined at 5837.25, the Mar 25 high.
COMMODITIES
BRENT TECHS: (M5) Bull Cycle Extends
- RES 4: $78.96 - High Jan 15 and a reversal trigger
- RES 3: $77.75 - High Jan 20
- RES 2: $76.26 - High Feb 20 and a bull trigger
- RES 1: $75.29 - High Apr 1
- PRICE: $74.40 @ 07:08 BST Apr 2
- SUP 1: $72.29 - 20-day EMA
- SUP 2: $69.51/67.95 - Low Mar 19 / 5 and the bear trigger
- SUP 3: $67.87 - Low Sep 10 ‘24 and a key medium-term support
- SUP 4: $66.55 1.618 proj of the Jan 15 - Feb 4 - 20 price swing
A strong rally in Brent futures Monday strengthens the current short-term bullish theme and undermines a medium-term bearish condition. The contract is trading at its recent highs and this signals scope for a climb towards the next key resistance at $76.26, the Feb 20. Clearance of this level would strengthen the bullish condition. Initial firm support to watch lies at $72.29, the 20-day EMA.
WTI TECHS: (K5) Key Resistance Remains Exposed
- RES 4: $76.57 - High Jan 15 and the bull trigger
- RES 3: $74.66 - High Jan 22
- RES 2: $72.91 - High Feb 11 and key resistance
- RES 1: $72.10 - High Apr 1
- PRICE: $71.10 @ 07:15 BST Apr 2
- SUP 1: $69.01 - 20-day EMA
- SUP 2: $66.09/64.85 - Low Mar 19 / 5 and the bear trigger
- SUP 3: $63.73 - Low Sep 10 ‘24 and a key medium-term support
- SUP 4: $60.98 - 1.764 proj of the Jan 15 - Feb 4 - 11 price swing
WTI futures traded sharply higher Monday. This undermines the medium-term bearish condition and instead signals scope for a continuation higher near-term. The rally has exposed the next key resistance at $72.91, the Feb 11 high. Clearance of this level would strengthen the bullish theme. On the downside, initial firm support to watch lies at $69.01, the 20-day EMA. A breach of this level would signal a potential reversal.
GOLD TECHS: Bulls Remain In The Driver’s Seat
- RES 4: $3200.00 - Round number resistance
- RES 3: $3196.2 - 3.236 proj of the Nov 14 - Dec 12 - 19 price swing
- RES 2: $3151.5 - 3.000 proj of the Nov 14 - Dec 12 - 19 price swing
- RES 1: $3149.0 - High Apr 1
- PRICE: $3116.5 @ 07:23 BST Apr 2
- SUP 1: $3076.9 - Low Mar 31
- SUP 2: $3015.2 - 20-day EMA
- SUP 3: $2956.2 - High Feb 24
- SUP 4: $2924.6 - 50-day EMA
The trend condition in Gold is unchanged, it remains bullish. The latest rally reinforces current conditions and confirms a continuation of the primary uptrend. The rally also once again, highlights fresh all-time highs for the yellow metal. Sights are on the $3151.5, a Fibonacci projection. Support to watch lies at $3004.9, the 20-day EMA. A pullback would be considered corrective.
SILVER TECHS: Bullish Trend Structure
- RES 4: $36.560 - 1.236 proj of the Dec 19 - Feb 14 - 28 price swing
- RES 3: $35.463 - 1.000 proj of the Dec 19 - Feb 14 - 28 price swing
- RES 2: $34.903 - High Oct 23 ‘24 and the bull trigger
- RES 1: $34.590 - High Mar 28
- PRICE: $34.731 @ 08:02 BST Apr 2
- SUP 1: $33.408 - 20-day EMA
- SUP 2: $32.665 - Low Mar 21
- SUP 3: $32.591/31.814 - 50-day EMA / Low Mar 11
- SUP 4: $30.815 - Low Feb 28 and key support
Trend conditions in Silver are unchanged, they remain bullish and recent gains reinforce this condition. The metal has breached $34.233, the Mar 18 high and a bull trigger. This confirms a resumption of the uptrend and maintains the price sequence of higher highs and higher lows. Sights are on $34.903, the Oct 23 ‘24 high and a medium-term bull trigger. Initial firm support to watch is $33.408, the 20-day EMA.