MNI DAILY TECHNICAL ANALYSIS - Volatility Overrides S/T Trends
Price Signal Summary – Volatility Overrides S/T Trends
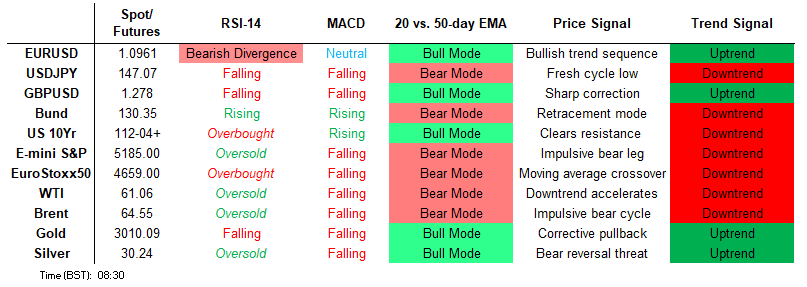
- S&P E-Minis continues to trade in a volatile manner. A bearish theme remains intact and the latest fresh cycle lows, strengthen current conditions. Scope is seen for an extension towards the 4800.00 handle next. Eurostoxx 50 futures remain in a bear cycle following the latest impulsive sell-off. Monday’s move down resulted in a breach of a key support at 4699.00, the Nov 19 ‘24 low (cont).
- EURGBP maintains a bullish tone and the cross is holding on to its latest gains. A key resistance at 0.8474, the Jan 20 high, has been cleared. The breach of this hurdle highlights an important technical break and strengthens a bullish condition. USDJPY maintains a bearish tone following last week’s sharp sell-off and the latest recovery is - for now - considered corrective. A resumption of the downtrend and a break of Friday’s 144.56 low would signal scope for an extension towards 144.13. The latest steep sell-off in AUDUSD cancels a recent bullish theme and instead, confirms a resumption of the downtrend that started late September last year.
- The trend condition in Gold remains bullish and the latest pull back appears corrective. Moving average studies are in a bull-mode position highlighting a dominant uptrend and positive market sentiment. A bearish theme in WTI futures remains intact following the recent impulsive sell-off. The move down has resulted in the breach of a number of important support levels. The break reinforces a bearish threat and, despite being in oversold territory, signals scope for a continuation of the bear leg.
- Bund futures trading in a volatile manner Monday. For now, a bull cycle remains in play and a pullback is considered corrective. A fresh short-term cycle high yesterday signals scope for a continuation of the uptrend. A sharp sell-off in the Gilt futures contract Monday highlights a strong reversal of the recent bull cycle between Mar 27 - Apr 7. A continuation down would expose the next key support located at 90.55, the Mar 27 low.
FOREIGN EXCHANGE
EURUSD TECHS: Support Remain Intact
- RES 4: 1.1276 High Jul 18 ‘23
- RES 3: 1.1214 High Sep 25 2024 and a key resistance
- RES 2: 1.1188 0.764 proj of the Feb 28 - Mar 18 - 27 price swing
- RES 1: 1.1144 High Oct 1 2024 / High Apr 3 and the bull trigger
- PRICE: 1.0977 @ 05:38 BST Apr 8
- SUP 1: 1.0812 Low Apr 7
- SUP 2: 1.0833 20-day EMA
- SUP 3: 1.0733 Low Mar 27 and a key short-term support
- SUP 4: 1.0684 50-day EMA and a short-term pivot level
EURUSD has pulled back from its latest high. For now, the trend condition remains bullish and a pullback is considered corrective. A key resistance at 1.0955, the Mar 18 high, was breached last week, confirming a resumption of the uptrend. It paves the way for a climb towards 1.1188 next, a Fibonacci projection. MA studies are in a bull-mode position highlighting a dominant uptrend. Initial firm support to watch lies at 1.0833, the 20-day EMA.
GBPUSD TECHS: Impulsive Corrective Pullback
- RES 4: 1.3274 High Oct 3 ‘24
- RES 3: 1.3207 High Apr 3 and the bull trigger
- RES 2: 1.3017 61.8% retracement of the Apr 3 - 7 sell-off
- RES 1: 1.2899 38.2% retracement of the Apr 3 - 7 sell-off
- PRICE: 1.2776 @ 06:09 BST Apr 8
- SUP 1: 1.2709 Low Apr 7
- SUP 2: 1.2669 2.0% 10-dma envelope
- SUP 3: 1.2654 50.0% retracement of the Jan 13 - Apr 3 bull cycle
- SUP 4: 1.2559 Low Feb 28
GBPUSD traded sharply lower Monday, extending the retracement from the Apr 3 high. For now, the sell-off appears corrective. Price has traded below the 50-day EMA - a concern for bulls - however, MA studies are in a bull mode position and this highlights a dominant uptrend. A recovery would open 1.2899 and 1.3017, Fibonacci retracement points. A move through Monday's 1.2709 low, would instead signal scope for a deeper retracement.
EURGBP TECHS: Holding On To Its Gains
- RES 4: 0.8645 High Apr 23 ‘24
- RES 3: 0.8625 High Aug 8 ‘24
- RES 2: 0.8604 1.382 proj of the Mar 3 - 11 - 28 price swing
- RES 1: 0.8593 High Aug 14 ‘24
- PRICE: 0.8584 @ 06:23 BST Apr 8
- SUP 1: 0.8470/0.8397 Low Apr 7 / 20-day EMA
- SUP 2: 0.8316 Low Mar 28 and a key near-term support
- SUP 3: 0.8299 Low Mar 5
- SUP 4: 0.8251 Low Mar 4
EURGBP maintains a bullish tone and the cross is holding on to its latest gains. A key resistance at 0.8474, the Jan 20 high, has been cleared. The breach of this hurdle highlights an important technical break and strengthens a bullish condition. Sights are 0.8593 next, the Aug 14 ‘24 high. On the downside, firm support lies at 0.8397, the 20-day EMA. The cross is overbought, a pullback would allow this condition to unwind.
USDJPY TECHS: Gains Considered Corrective
- RES 4: 151.30 High Mar 3
- RES 3: 150.33/151.21 50-day EMA / High Mar 28 and reversal trigger
- RES 2: 149.00 20-day EMA
- RES 1: 148.18 Low Mar 20
- PRICE: 147.63 @ 06:53 BST Apr 8
- SUP 1: 144.56 Low Apr 4
- SUP 2: 144.13 76.4% retracement of the Sep 16 ‘24 - Jan 10 bull leg
- SUP 3: 143.43 Low Oct 2 ‘24
- SUP 4: 142.95 1.00 proj of the Feb 12 - Mar 11 - 28 price swing
USDJPY maintains a bearish tone following last week’s sharp sell-off and the latest recovery is - for now - considered corrective. A resumption of the downtrend and a break of Friday’s 144.56 low would signal scope for an extension towards 144.13, a Fibonacci retracement point. Initial firm resistance to watch is 149.00, the 20-day EMA. Resistance at the 50-day EMA, is at 150.33.
EURJPY TECHS: Strong Bounce Reinforces A Bullish Theme
- RES 4: 165.43 High Nov 8
- RES 3: 164.90 High Dec 30 ‘24 and a key medium-term resistance
- RES 2: 164.55 High Jan 7
- RES 1: 162.37/164.19 High Apr 7 / High Mar 18 and the bull trigger
- PRICE: 161.88 @ 07:18 GMT Apr 8
- SUP 1: 158.30 Low Apr 7
- SUP 2: 157.02 76.4% retracement of the Feb 28 - Mar 18 bull cycle
- SUP 3: 155.60 Low Low Mar 4
- SUP 4: 154.80 Low Low Feb 28
EURJPY is trading in a volatile manner. The latest pullback still appears corrective, and the strong rally off Monday’s low reinforces this theme. Key short-term support has been defined at 158.30, Monday’s low. A break of this level is required to signal scope for a deeper retracement. For bulls, the cross has traded through the 20-day EMA. A continuation higher would expose 164.19, the Mar 18 high and the bull trigger.
AUDUSD TECHS: Bearish Outlook
- RES 4: 0.6409 High Dec 9 and a key resistance
- RES 3: 0.6389 High Apr 3
- RES 2: 0.6283 50-day EMA
- RES 1: 0.6127/0.6219 High Apr 7 / Low Mar 31
- PRICE: 0.6059 @ 08:01 BST Apr 8
- SUP 1: 0.5931 1.764 proj of the Sep 30 - Nov 6 - 7 price swing
- SUP 2: 0.5900 Round number support
- SUP 3: 0.5830 2.000 proj of the Sep 30 - Nov 6 - 7 price swing
- SUP 4: 0.5729 2.236 proj of the Sep 30 - Nov 6 - 7 price swing
The latest steep sell-off in AUDUSD cancels a recent bullish theme and instead, confirms a resumption of the downtrend that started late September last year. Monday’s fresh cycle low reinforces a bear theme. A key support at 0.6088, the Feb 3 low, has been broken. This paves the way for an extension towards 0.5931 next, a Fibonacci projection. On the upside, resistance to watch is at 0.6219, the Mar 31 low.
USDCAD TECHS: Trend Structure Remains Bearish
- RES 4: 1.4452/4543 High Mar 13 / 4 and a bull trigger
- RES 3: 1.4415 High Apr 1
- RES 2: 1.4302 50-day EMA
- RES 1: 1.4248 Intraday high
- PRICE: 1.4163 @ 08:09 BST Apr 8
- SUP 1: 1.4028 Low Apr 3 and the bear trigger
- SUP 2: 1.3986 Low Dec 2 ‘24
- SUP 3: 1.3944 61.8% retracement of Sep 25 ‘24 - Feb 3 bull run
- SUP 4: 1.3894 Low Nov 11 ‘24
USDCAD has recovered from last week’s low. For now, the move higher appears corrective. The sell-off last week confirmed a resumption of the medium-term bear cycle that started Feb 3. Price has traded through a key support at 1.4151, the Feb 14 low, and this signals scope for an extension towards 1.3944, a Fibonacci retracement. On the upside, key short-term resistance is seen at 1.4302, the 50-day EMA.
FIXED INCOME
BUND TECHS: (M5) Corrective Pullback
- RES 4: 132.80 High Feb 5
- RES 3: 132.56 High Feb 28 and a key resistance
- RES 2: 132.03 High Apr 7 and the bull trigger
- RES 1: 130.57 50.0% retracement of Monday’s high-low range
- PRICE: 130.03 @ 05:30 BST Apr 8
- SUP 1: 129.83 50-day EMA
- SUP 2: 129.15/128.47 20-day EMA / Low Mar 28
- SUP 3: 127.74 Low Mar 25 and a key short-term support
- SUP 4: 127.20 Low Mar 17
Bund futures trading in a volatile manner Monday. For now, a bull cycle remains in play and a pullback is considered corrective. A fresh short-term cycle high yesterday signals scope for a continuation of the uptrend. The contract has cleared 131.14, 76.4% of the Feb 28 - Mar 11 bear leg. This strengthens the bullish condition and opens 132.56, the Feb 28 high. Initial firm support to watch lies at 129.15, the 20-day EMA.
BOBL TECHS: (M5) Trend Structure Remains Bullish
- RES 4: 120.000 Psychological round number
- RES 3: 119.960 High Apr 7
- RES 2: 119.594 76.4% retracement of Monday’s high-low range
- RES 1: 119.185 50.0% retracement of Monday’s high-low range
- PRICE: 119.360 @ 06:14 BST Apr 7
- SUP 1: 118.410/117.895 Low Apr 7 / 20-day EMA
- SUP 2: 117.410 Low Mar 27
- SUP 3: 117.600 Low Mar 28
- SUP 4: 117.080 Low Mar 25 and a ey short-term support
Bobl futures have pulled back from their recent highs and yesterday, the contract traded in a volatile manner. Last week’s gains resulted in a break of key resistance at 119.040, the Feb 28 high. This strengthens bullish conditions and signals scope for a continuation. The focus is on the 120.000 handle next. The contract is overbought, a deeper pullback would allow this condition to unwind. Initial firm support lies at 117.895, the 20-day EMA.
SCHATZ TECHS: (M5) Trend Needle Points North
- RES 4: 107.835 2.000 retracement proj of the Mar 4 - 6 bear leg
- RES 3: 107.775 High Apr 7 / Psychological round number
- RES 2: 107.648 76.4% retracement of Monday’s high-low range
- RES 1: 107.505 50.0% retracement of Monday’s high-low range
- PRICE: 107.425 @ 06:02 BST Apr 8
- SUP 1: 107.235 Low Apr 7
- SUP 2: 107.120 High MAr 4 and a recent breakout level
- SUP 3: 106.969 20-day EMA
- SUP 4: 106.830 Low Mar 27
Schatz futures maintain a firmer tone despite Monday’s volatile price action. The contract has recently traded through a key resistance at 107.120, the Mar 4 high. This confirmed a full reversal of the Apr 3 - 6 impulsive sell-off. The break also highlights a stronger bull cycle and signals scope for a climb towards 107.800 next. Initial firm support is seen at 106.969, the 20-day EMA.
GILT TECHS: (M5) Key Support Remains Exposed
- RES 4: 94.75 76.4% retracement of the Dec 3 - Jan 13 bear leg (cont)
- RES 3: 94.50 High Apr 7 and key resistance
- RES 2: 93.38 61.8% retracement of the Apr 7 high-low range
- RES 1: 92.70 38.2% retracement of the Apr 7 high-low range
- PRICE: 92.01 @ 08:12 BST Apr 8
- SUP 1: 91.58 Low Apr 7
- SUP 2: 91.03 Low Mar 28
- SUP 3: 90.55 Low MAr 27 and key support
- SUP 4: 9.00 Psychological round number
A sharp sell-off in the Gilt futures contract Monday highlights a strong reversal of the recent bull cycle between Mar 27 - Apr 7. A continuation down would expose the next key support located at 90.55, the Mar 27 low. Clearance of this level would confirm a full reversal of the Mar 27 - Apr 7 rally. On the upside, a resumption of gains would initially open 92.70 and 93.38, Fibonacci retracement points of Monday’s high-low range.
BTP TECHS: (M5) Has Traded Through The 20-Day EMA
- RES 4: 120.39 High Feb 28 and a key resistance
- RES 3: 120.12 High High Mar 4
- RES 2: 119.31 Low Mar 4 and a gap high on the daily chart
- RES 1: 119.07 High Apr 4
- PRICE: 117.59 @ 07:09 BST Apr 8
- SUP 1: 117.41 50.0% retracement of the Mar 14 - Apr 4 bull cycle
- SUP 2: 116.89 Low Mar 25 and a key short-term support
- SUP 3: 116.53 76.4% retracement of the Mar 14 - Apr 4 bull cycle
- SUP 4: 115.75 Low Mar 14
BTP futures maintain a firmer short-term tone and the latest pullback is considered corrective. A resumption of the bull cycle would signal scope for an extension towards 119.31, the Mar 4 low and gap high on the daily chart. On the downside, the 20-day EMA has been breached. This undermines the bull theme. The next support to watch lies at 117.41, a Fibonacci retracement. A break would strengthen a bearish threat.
EQUITIES
EUROSTOXX50 TECHS: (M5) Impulsive Bear Cycle Remains In Play
- RES 4: 5190.52 20-day EMA
- RES 3: 5047.00 High Apr 4
- RES 2: 4931.00 Low Jan 13 (cont)
- RES 1: 4809.00 Low Dec 20 ‘24 (cont)
- PRICE: 4676.00 @ 06:29 BST Apr 8
- SUP 1: 4444.00 - Low Apr 7
- SUP 2: 4372.46 76.4% retracement of the Oct ‘23 - Mar ‘25 bull cycle
- SUP 3: 4336.00 Low Nov 28 ‘23 (cont)
- SUP 4: 4302.00 Low Nov 15 ‘23 (cont)
Eurostoxx 50 futures remain in a bear cycle following the latest impulsive sell-off. Monday’s move down resulted in a breach of a key support at 4699.00, the Nov 19 ‘24 low (cont). This exposes 4372.46, the 76.4% retracement of the Oct ‘23 - Mar ‘25 bull cycle. The contract is oversold, a recovery would allow this condition to unwind. Initial resistance is 4809.00, the Dec 20 ‘24 low (cont).
E-MINI S&P: (M5) Bear Cycle Remains Intact
- RES 4: 5797.02 50-day EMA
- RES 3: 5610.64 20-day EMA
- RES 2: 5435.00 High Apr 4
- RES 1: 5286.50 High Apr 7
- PRICE: 5164.00 @ 06:38 BST Apr 8
- SUP 1: 4832.00 Low APr 7
- SUP 2: 4760.88 1.618 proj of the Feb 19 - Mar 13 - 25 price swing
- SUP 3: 4663.75 1.764 proj of the Feb 19 - Mar 13 - 25 price swing
- 7SUP 4: 4519.84 61.8% retracement of the Oc ‘22 - Feb ‘25 bull cycle
S&P E-Minis continues to trade in a volatile manner. A bearish theme remains intact and the latest fresh cycle lows, strengthen current conditions. Scope is seen for an extension towards the 4800.00 handle next. Moving average studies are in a bear-mode position, highlighting a dominant downtrend. Key short-term resistance has been defined at 5837.25, the Mar 25 high. Initial firm resistance is seen at 5610.64, the 20-day EMA.
COMMODITIES
BRENT TECHS: (M5) Trading Closer To Its Recent Lows
- RES 4: $77.75 - High Jan 20
- RES 3: $76.26 - High Feb 20
- RES 2: $72.00/75.47 - 50-day EMA / High Apr 2 and a bull trigger
- RES 1: $67.95 - Low Mar 5 and a recent breakout level
- PRICE: $64.83 @ 06:56 BST Apr 8
- SUP 1: $62.51 - Low Apr 7
- SUP 2: $61.97 - 2.236 proj of the Jan 15 - Feb 4 - 20 price swing
- SUP 3: $60.00 - Psychological round number
- SUP 4: $58.26 - 3.000 proj of the Jan 15 - Feb 4 - 20 price swing
Brent futures continue to trade in a volatile manner and the contract remains closer to its recent lows. The move down cancels a recent bullish theme. Price has traded cleared both the 20- and 50-day EMAs. Furthermore, the contract has breached $67.87, the Oct 10 ‘24 low. This signals scope for a continuation towards $61.97, a Fibonacci projection. On the upside, initial firm resistance is seen at $67.95, the Mar 5 low.
WTI TECHS: (K5) Bear Threat Remains Present
- RES 4: $74.66 - High Jan 22
- RES 3: $72.91 - High Feb 11
- RES 2: $68.72/72.28 - 50-day EMA / High Apr 2 and key resistance
- RES 1: $64.85 Low Mar 5 low and a recent breakout level.
- PRICE: $61.34 @ 07:00 BST Apr 8
- SUP 1: $58.95 - Low Apr 7
- SUP 2: $57.79 - 2.236 proj of the Jan 15 - Feb 4 - 11 price swing
- SUP 3: $56.81 - 2.382 proj of the Jan 15 - Feb 4 - 11 price swing
- SUP 4: $55.00 - Round number support
A bearish theme in WTI futures remains intact following the recent impulsive sell-off. The move down has resulted in the breach of a number of important support levels. The break reinforces a bearish threat and, despite being in oversold territory, signals scope for a continuation of the bear leg. Sights are on $57.79 next, a Fibonacci projection. Initial resistance is seen at $64.85, the Mar 5 low and a recent breakout level.
GOLD TECHS: Monitoring Support At The 50-Day EMA
- RES 4: $3223.8 - 3.382 proj of the Nov 14 - Dec 12 - 19 price swing
- RES 3: $3200.00 - Round number resistance
- RES 2: $3196.2 - 3.236 proj of the Nov 14 - Dec 12 - 19 price swing
- RES 1: $3055.6/3167.8 - High Apr 7 / 3 and bull trigger
- PRICE: $3005.0 @ 06:59 BST Apr 8
- SUP 1: $2956.7 - Low Apr 7
- SUP 2: $2945.3 - 50-day EMA
- SUP 3: $2880.3 - Low Mar 10
- SUP 4: $2832.7 - Low Feb 28
The trend condition in Gold remains bullish and the latest pull back appears corrective. Moving average studies are in a bull-mode position highlighting a dominant uptrend and positive market sentiment. Price has traded through the 20-day EMA. The next key support to watch lies at 2945.3, the 50-day EMA. A resumption of gains would refocus attention on $3196.2, a Fibonacci projection. The bull trigger is 3167.8, the Apr 3 high.
SILVER TECHS: Impulsive Reversal Wave
- RES 4: $34.903 - High Oct 23 ‘24 and the bull trigger
- RES 3: $32.947/34.590 - 20-day EMA / High Mar 28
- RES 2: $32.491 - 50-day EMA
- RES 1: $30.815 - Low Feb 28
- PRICE: $30.172 @ 08:12 BST Apr 8
- SUP 1: $28.351 - Low Apr
- SUP 2: $27.686 - Low Sep 6 ‘24
- SUP 3: $27.180 - Low Aug 14 ‘24
- SUP 4: $26.451 - Low Aug 8 ‘24 and a key support
Silver continues to trade in a volatile manner. Last week’s sell-off confirmed a clear reversal of its recent uptrend. The metal yesterday traded through support at $28.748, the Dec 19 low. A clear break of this level would signal scope for a continued sell-off, towards $27.686, the Sep 6 ‘24 low. Initial resistance to watch is $30.815, the Feb 28 low. The contract is oversold, gains would allow this set-up to unwind.