MNI US MARKETS ANALYSIS - Risk-off Pervades, Fed Pricing Slips
Highlights:
- Gold sees no benefit from risk-off, Gold/EUR on track for worst session in months
- Fed pricing slips sharp as growth hit seen outweighing inflationary pressure
- Global tariff countermeasures in focus as world gets used to new normal
US TSYS: Gains Pared But Belly-Led Rally Holds With Some Notable Data Ahead
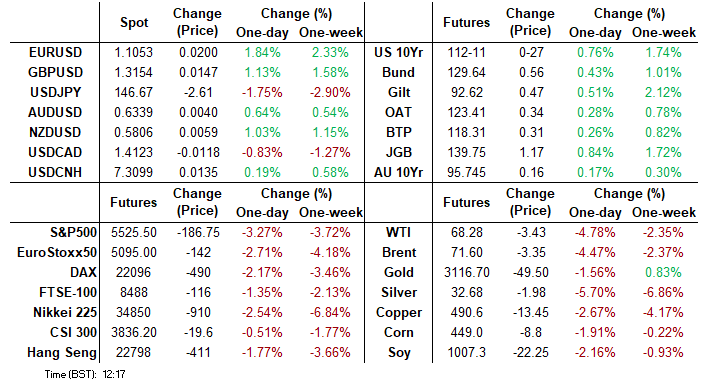
- Treasuries have shifted back towards the lower end of overnight ranges but hold a firm belly-led rally on the day after yesterday’s “Liberation Day” tariff announcement triggers large risk-off moves.
- Cash yields are 2-6.5bp lower on the day to extend the rally seen late yesterday. The day’s declines are led by the belly whilst 30s lag the move.
- TYM5 trades at 112-13 (+29) off overnight highs of 112-24+, on huge cumulative volumes already above 1mln.
- The contract has firmly resumed its uptrend, punching through 112-01 (Mar 4 high) and next opening 113-05 (Fibo projection). To the downside, support at 111-17+ (Mar 20 high).
- Today sees tariff and/or retaliation headlines firmly in focus but also with multiple potentially market moving releases including ISM services, jobless claims and Challenger job cuts. The latter wouldn’t normally get a mention but saw a sizeable rates rally last month after their sharp spike higher.
- Data: Challenger job cuts Mar (0730ET), Weekly jobless claims (0830ET), Trade balance Feb final (0830ET), S&P Global US serv/comp PMI Mar final (0945ET), ISM services Mar (1000ET)
- Fedspeak: Jefferson on economic outlook (1230ET, text + Q&A), Cook on economic outlook (1430ET, text + Q&A) – neither have spoken recently.
- Bill issuance: US Tsy $80B 4W, $75B 8W bill auctions (1130ET)
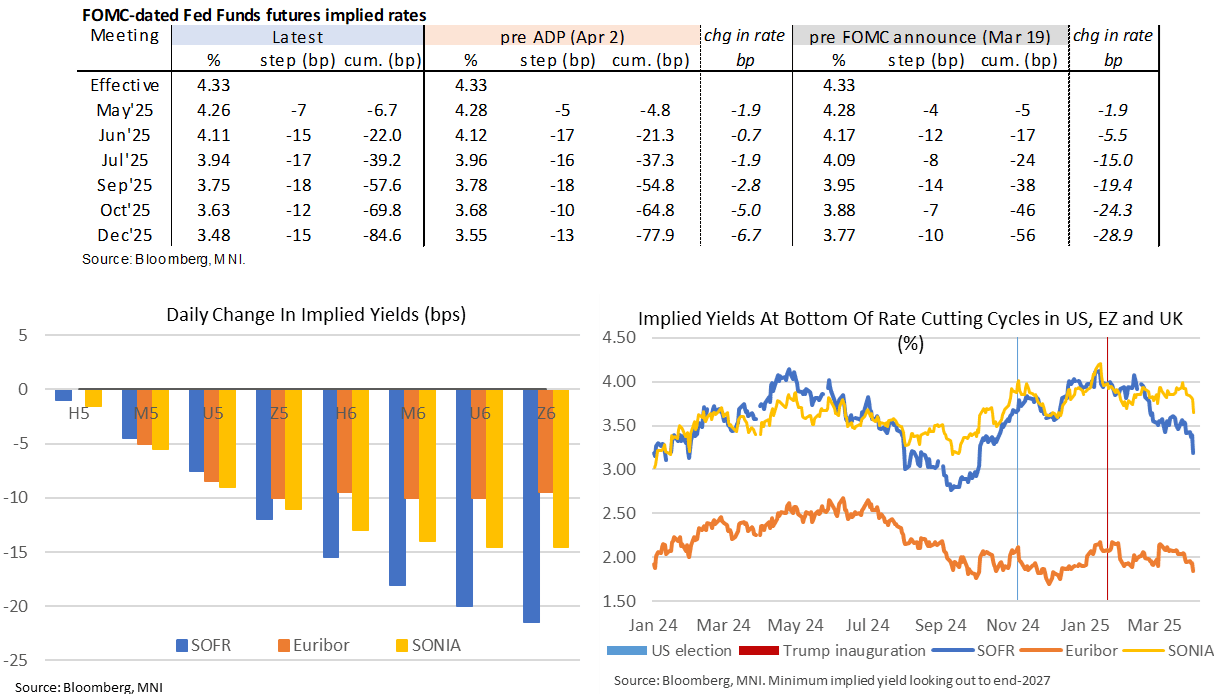
STIR: Fed Terminal Rate Holds Tumble After Tariff Announcements
- Fed Funds implied rates are off overnight lows but firmly towards the dovish end of recent ranges for 2025 meetings in response to yesterday’s wide-ranging tariff announcements.
- Cumulative cuts from 4.33% effective: 6.5bp May, 22bp Jun, 39bp Jul and 85bp Dec.
The negative growth implications are clearer further out the curve, with the SOFR implied terminal yield currently ~20bps lower on the day to 3.19% (~115bp of cuts) for its lowest since early Oct 2024. - This perceived bottoming for the rates cycle has been kicked back a contract, from the U6 to Z6.
- Retaliation headlines and data are in near-term focus, with ISM services, jobless claims, trade details and Challenger job cuts (which were market moving last month).
- We also see Fedspeak from two permanent voters later on, with Jefferson last speaking on mon pol on Feb 19 and Cook in early January:
- 1230ET – Jefferson on economic outlook and central bank comms (text + Q&A).
- 1430ET – Gov. Cook on economic outlook (text + Q&A).
US TSY FUTURES: Short Setting Most Prominent On Wednesday
OI data points to net short setting across most Tsy futures on Wednesday, with only modest net long cover in US futures breaking the wider theme.
- Cover of those shorts could be factoring into today’s rally.
| 02-Apr-25 | 01-Apr-25 | Daily OI Change | OI DV01 Equivalent Change ($) |
TU | 3,932,710 | 3,918,568 | +14,142 | +544,462 |
FV | 6,558,128 | 6,520,241 | +37,887 | +1,664,225 |
TY | 4,923,175 | 4,891,221 | +31,954 | +2,084,072 |
UXY | 2,324,533 | 2,322,706 | +1,827 | +166,063 |
US | 1,839,503 | 1,843,637 | -4,134 | -555,124 |
WN | 1,822,281 | 1,814,672 | +7,609 | +1,510,883 |
|
| Total | +89,285 | +5,414,581 |
STIR: Mix Of SOFR Short Setting & Long Cover On Wednesday
OI data points to a mix of short setting and long cover during yesterday’s downtick in SOFR futures.
- Today's initial reaction to yesterday’s tariff announcements has seen the strip bull fatten, with inflationary risks offsetting some of the growth-related worry in the very front end of the strip, but doing little further out.
| 02-Apr-25 | 01-Apr-25 | Daily OI Change |
| Daily OI Change In Packs |
SFRH5 | 1,138,184 | 1,156,698 | -18,514 | Whites | -34,140 |
SFRM5 | 1,283,227 | 1,288,149 | -4,922 | Reds | +35,457 |
SFRU5 | 933,957 | 955,070 | -21,113 | Greens | -1,441 |
SFRZ5 | 1,085,638 | 1,075,229 | +10,409 | Blues | +17,282 |
SFRH6 | 653,044 | 646,380 | +6,664 |
|
|
SFRM6 | 681,945 | 689,069 | -7,124 |
|
|
SFRU6 | 633,449 | 629,797 | +3,652 |
|
|
SFRZ6 | 815,988 | 783,723 | +32,265 |
|
|
SFRH7 | 513,942 | 517,426 | -3,484 |
|
|
SFRM7 | 492,426 | 486,031 | +6,395 |
|
|
SFRU7 | 318,385 | 323,673 | -5,288 |
|
|
SFRZ7 | 432,177 | 431,241 | +936 |
|
|
SFRH8 | 231,997 | 229,711 | +2,286 |
|
|
SFRM8 | 191,931 | 191,932 | -1 |
|
|
SFRU8 | 135,400 | 134,761 | +639 |
|
|
SFRZ8 | 154,803 | 140,445 | +14,358 |
|
|
TARIFFS: EU Could Impose 20% Tariffs On US Services As Part Of Retaliation [1/2]
- We’ve had some questions on how yesterday’s universal US tariffs would look if factoring in services trade.
- There’s a reason though that the US has been only focused on goods trade: it runs a good deficit equivalent to 4.4% GDP (in sa data for Q4) vs services surplus of 1.0% GDP (worth $295bn in 2024).
- What’s more, that goods deficit looks a little worse when stripping out the $50bn it received from net trade in petroleum products last year. The ex-petroleum deficit was 4.6% GDP in Q4 vs a petroleum surplus of 0.2% GDP, with the trend deteriorating over a multi-year period as the US shifted to a net oil exporter. It explains the oil exemption to the tariffs along with being an attempt to limit the domestic inflationary aspects of the ‘reciprocal tariffs’.
- Looking at US service imports by major partner, the EU is clearly the largest contributor with US imports worth $201bn (0.7% GDP) in 2024 although the US exported $277bn. That left a US-EU surplus of $77bn or 0.25% GDP.
- The UK is the largest single country service exporter to the US in the select list provided by the BEA, with US imports worth $90bn (0.3% GDP) but that’s entirely matched by exports whilst left a US-UK surplus of just $3.6bn or 0.01% GDP.
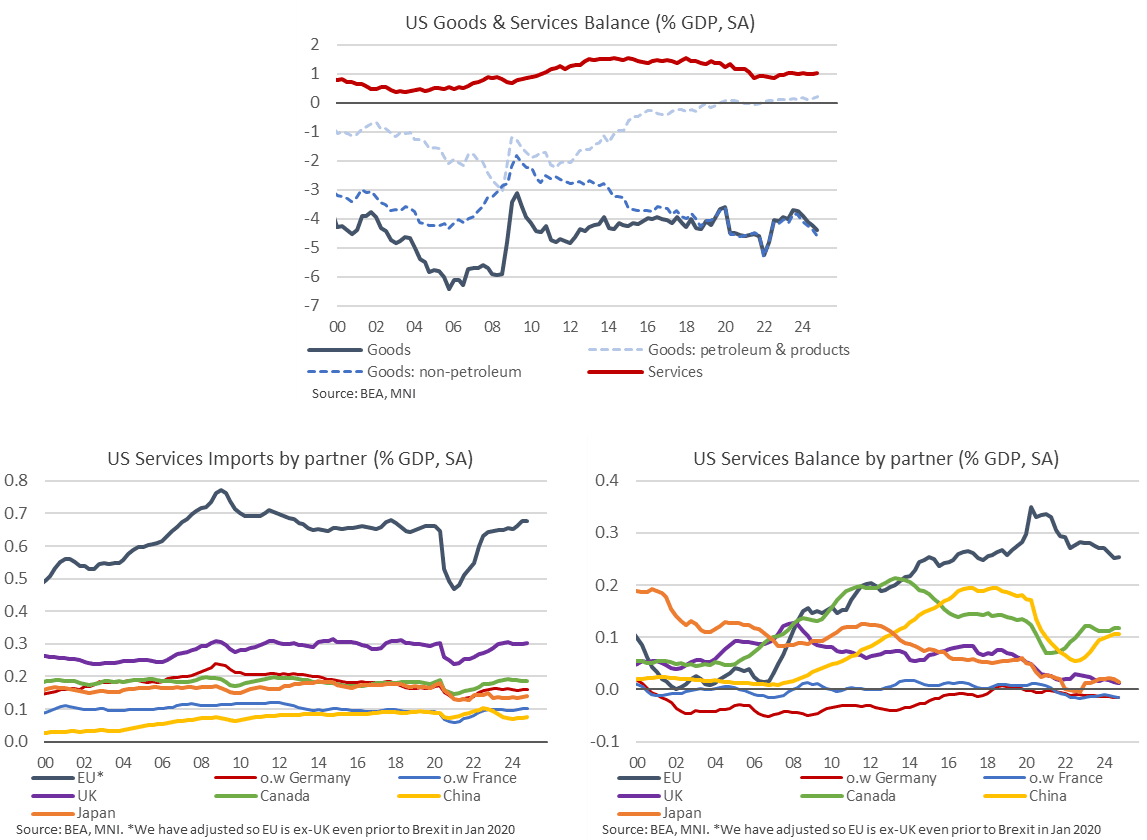
TARIFFS: EU Could Impose 20% Tariffs On US Services As Part Of Retaliation [2/2]
- Where does that leave potential EU retaliation after yesterday’s 20% tariffs placed on by the US, with EU’s von der Leyen saying “we are now preparing for further countermeasures” and the bloc was “prepared to respond”?
- It just so happens that the formula that the USTR provided yesterday, to justify differentiated goods tariff rates by country, would point to the EU applying a matching 20% (technically 19%) tariff on US services.
- Of course, US-EU services trade is much smaller than goods, with US imports from the EU worth 2.0% GDP and a US trade deficit worth 0.8% GDP in 2024.
- That said, when it comes to expectations around EU retaliation, recall that the MNI Policy team yesterday wrote that EU retaliation may take about a month and a half to implement at the earliest (see MNI: EU Liberation Day Retaliation May Take Time – EU Source).
FOREX: EUR/USD Rips Through $1.10 as USD Over 1% Lower Than Election
- The greenback's step lower on yesterday's tariff announcement is extending into Thursday's NY crossover, prompting the USD Index to break comfortably through 103.00 and plumb the lowest levels since early October. This puts the currency over 1% lower relative to Trump's election and near 7% lower since his inauguration in January.
- Dwindling Fed pricing is largely responsible here, with markets adopting the view that softer-than-expected global economic growth with counter the inflationary pressure of levies, and force the Fed's hand in cutting rates more aggressively for the remainder of 2025.
- Unsurprisingly then, the greenback is by a distance the weakest currency in G10 - with haven currencies JPY and CHF firmer. Interestingly, the single currency is rallying sharply as markets look to the EU for their countermeasure response, which is likely to pressure US services and tech firms on top of measures to support local growth and domestic businesses. As a result, EUR/USD has rallied through the $1.10 handle, breaking mid-March resistance in the process.
- Antipodean currencies are not benefiting, however, with AUD and NZD among the weakest in G10 as APAC trade partners are hit with among the most punitive tariff measures on Trump's table - with China, Vietnam and Cambodia seeing the sharpest rates, on top of the 10% levy for Australia itself.
- Any further commentary from Trump's team is unlikely Thursday, with his schedule light on public events. Topically, trade balance data from the US and Canada crosses as well as ISM Services data and the weekly jobless claims release. Fed's Jefferson & Cook will be watched carefully, however it's Powell's speech on the economic outlook on Friday that takes primary focus.
EUR: Volume Surge Makes For Busiest Day of Trump's Term for FX
This likely goes without saying, but the volume spike on this latest break higher in EUR/USD is significant: over 16,000 EUR futures contracts traded inside three minutes.
- That's the largest EURUSD futures volume, appropriately, since January 20th and the day of Trump's inauguration, where a WSJ headline: "*TRUMP PLANS BROAD MEMORANDUM TO STUDY TRADE POLICIES MONDAY:WSJ" triggered another phase of USD weakness.
- Today's trade in currency futures is unsurprisingly well ahead of average, over tripling the volume you'd expect to see at this time of day, with over $2.3bln notional traded on the way through $1.1100 - making this the busiest day for the pair since Trump was sworn in.
GOLD: Spot Sees Little Benefit from Risk-Off, as Tariff Avoidance Hits Price
Given the sharp decline in the USD, US yields and the risk-off backdrop (evident in the 3% drop in US stock futures), Gold weakness stands out, with spot erasing early gains to briefly show through yesterday's lows - but it's the EUR-denominated gold price that stands out: lower by 2.75% on the day for the biggest daily decline since November 5th last year.
- Trump didn't mention gold or metals tariffs at yesterday's event, meaning the building US inventories across his term so far (on speculation that future trade could be tariffed) is now feeding through to prices - meaning the US-London gold price spread has narrowed considerably today.
- While gold is weaker, silver is weaker still: the gold/silver ratio has surged through 95.00 for the first time since Q3'22, providing further evidence of broad selling in precious metals.
FOREX: USDSEK Drops 3%, Breaching June 2022 Low at 9.6783
- Latest dynamics in FX markets have allowed the best performing currencies in 2025 to extend their recent trends, alongside the substantial weakening of the US dollar. With that in mind, the Swedish Krona is soaring, and USDSEK has extended its annual decline to ~12.5%.
- Downside momentum has been assisted by the break of the March lows at 9.9488, with the key medium-term support also giving way at 9.9066, the Dec 2023 low. In most recent trade, USDSEK has extended the intra-day decline to 3%, and is currently breaking below the June 2022 lows of 9.6783.
- In sympathy, EURSEK has also tested the November 2022 lows below 10.68.
- Riksbank Deputy Governor Per Jansson told MNI on Tuesday that rising trade tariffs are likely to depress economic growth, but while their effects on inflation may be short-lived, monetary policymakers must be alert to any risk of price expectations becoming de-anchored.
- The focus will turn to Friday’s preliminary release of March inflation, where the annual reading for CPIF excl. energy is expected to tick higher to 3.2%, from 3.0% in Feb.
OPTIONS: Expiries for Apr03 NY cut 1000ET (Source DTCC)
- EUR/USD: $1.0800(E3.5bln), $1.0850(E1.1bln), $1.0875(E1.6bln), $1.0900(E863mln)
- USD/JPY: Y147.00($1.8bln), Y148.00($1.8bln), Y148.25-35($1.3bln), Y150.00($1.2bln)
- GBP/USD: $1.2840-50(Gbp868mln)
- EUR/JPY: Y165.90(E549mln)
- AUD/USD: $0.6290-00(A$920mln), $0.6320(A$566mln), $0.6400-10(A$1.8bln)
- NZD/USD: $0.5715-20(N$520mln)
- USD/CAD: C$1.4280($660mln), C$1.4370-75($1.2bln)
EQUITIES: Fresh Cycle Lows in E-Mini S&P Strengthens Bearish Theme
- Eurostoxx 50 futures remain in a bear cycle following recent weakness and today’s fresh cycle low strengthens the bearish condition. Recent weakness resulted in a break of support at 5229.00, the Mar 11 low. This signals scope for an extension towards 5079.00, the Feb 3 low. Initial firm resistance is 5325.98, the 20-day EMA. A clear break of this average is required to highlight a reversal.
- S&P E-Minis are trading in a volatile manner. A bearish theme remains intact and today’s fresh cycle low, strengthens current conditions. A resumption of weakness would signal scope for an extension towards 5396.00, a Fibonacci projection. Moving average studies are in a bear-mode position, highlighting a dominant downtrend. Key short-term resistance has been defined at 5837.25, the Mar 25 high.
COMMODITIES: WTI Futures Sharply Reverse This Week's Earlier Move Higher
- WTI futures traded sharply higher earlier this week. This continues to signal scope for an extension of the bull cycle near-term, and the latest pullback is considered corrective - for now. A resumption of gains would refocus attention on key resistance at $72.91, the Feb 11 high. Clearance of this level would strengthen a bullish theme. Support to watch is $69.26, the 20-day EMA. It has been pierced, a clear break of it would highlight a reversal.
- The trend condition in Gold is unchanged, it remains bullish and today’s fresh cycle high reinforces current conditions. Moving average studies remain in a bull-mode position highlighting a dominant uptrend and positive market sentiment. The next upside objective is $3196.2, a Fibonacci projection, ahead of the $3200.0 handle. On the downside, key short-term support lies at $3026.6, the 20-day EMA.
| Date | GMT/Local | Impact | Country | Event |
| 03/04/2025 | 1230/0830 | *** | Jobless Claims | |
| 03/04/2025 | 1230/0830 | ** | WASDE Weekly Import/Export | |
| 03/04/2025 | 1230/0830 | ** | International Merchandise Trade (Trade Balance) | |
| 03/04/2025 | 1230/0830 | ** | Trade Balance | |
| 03/04/2025 | 1345/0945 | *** | S&P Global Services Index (final) | |
| 03/04/2025 | 1345/0945 | *** | S&P Global US Final Composite PMI | |
| 03/04/2025 | 1400/1000 | *** | ISM Non-Manufacturing Index | |
| 03/04/2025 | 1430/1030 | ** | Natural Gas Stocks | |
| 03/04/2025 | 1530/1130 | ** | US Bill 04 Week Treasury Auction Result | |
| 03/04/2025 | 1530/1130 | * | US Bill 08 Week Treasury Auction Result | |
| 03/04/2025 | 1630/1230 | Fed Vice Chair Philip Jefferson | ||
| 03/04/2025 | 1830/1430 | Fed Governor Lisa Cook | ||
| 04/04/2025 | 2330/0830 | ** | Household spending | |
| 04/04/2025 | 0545/0745 | ** | Unemployment | |
| 04/04/2025 | 0600/0800 | Flash CPI | ||
| 04/04/2025 | 0600/0800 | ** | Manufacturing Orders | |
| 04/04/2025 | 0600/0800 | *** | Flash Inflation Report | |
| 04/04/2025 | 0630/0730 | DMO announce Apr-Jun issuance operations | ||
| 04/04/2025 | 0645/0845 | * | Industrial Production | |
| 04/04/2025 | 0700/0900 | ** | Industrial Production | |
| 04/04/2025 | 0730/0930 | ** | S&P Global Final Eurozone Construction PMI | |
| 04/04/2025 | 0800/1000 | * | Retail Sales | |
| 04/04/2025 | 0800/1000 | ECB's De Guindos Gives Lecture In Barcelona | ||
| 04/04/2025 | 0830/0930 | ** | S&P Global/CIPS Construction PMI | |
| 04/04/2025 | 1230/0830 | *** | Employment Report | |
| 04/04/2025 | 1525/1125 | Fed Chair Jerome Powell | ||
| 04/04/2025 | 1600/1200 | Fed Governor Michael Barr | ||
| 04/04/2025 | 1645/1245 | Fed Governor Chris Waller | ||
| 04/04/2025 | 1700/1300 | ** | Baker Hughes Rig Count Overview - Weekly | |
| 04/04/2025 | 1700/1300 | ** | Baker Hughes Rig Count Overview - Weekly |