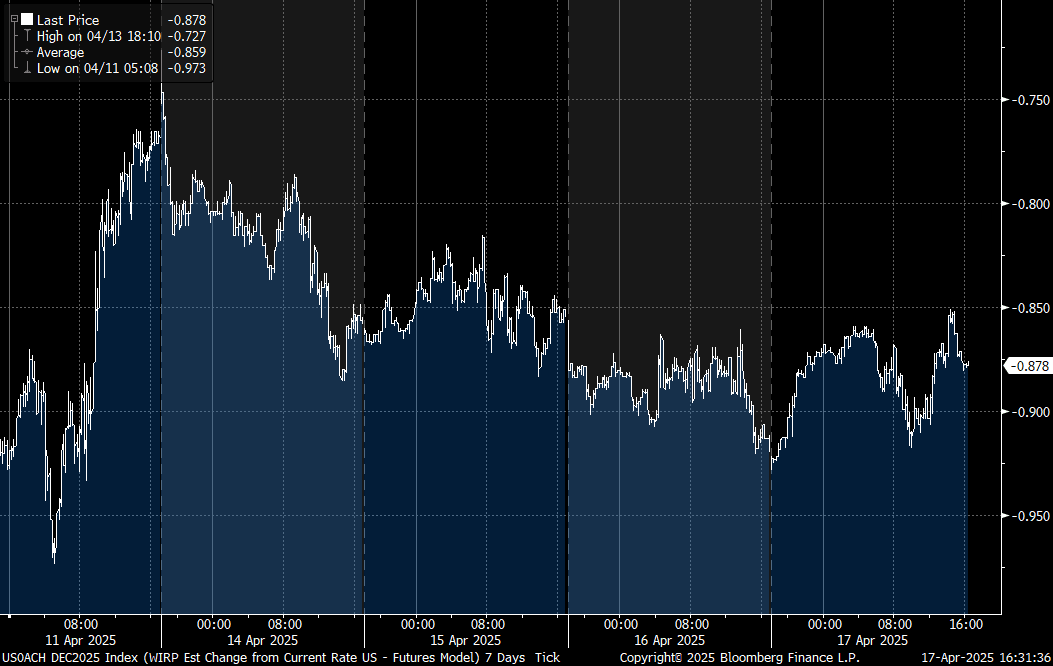
STIR: Retracing Last Week’s Hawkish Shift
- Implied Fed rates saw mixed repricing this week.
- A May cut has all but been priced out at this point, thanks in part to a calming of financial market volatility but also the patient approach to easing reiterated by multiple FOMC officials, most prominently Chair Powell Wednesday.
- There’s now just 12% implied probability of a May cut, with the next cut still only fully priced by end-July.
- Further down the strip however, rate cut pricing increased vs last Friday’s close, with 87bp of reductions eyed by December.
- This was largely a retracement of the prior week’s late hawkish shift on an equity rally – though ironically it was Powell’s cautious tone that saw the deepest pricing for rate cuts of the week, as he triggered a leg lower in equities and a risk-off rally.
Meeting | Current FF Implieds (%), LH | Cumulative Change From Current Rate (bp) | Incremental Chg (bp) | Last Fri (Apr 11) | Chg Since Then (bp) |
May 07 2025 | 4.30 | -2.9 | -2.9 | 4.26 | 4.2 |
Jun 18 2025 | 4.15 | -17.8 | -14.9 | 4.10 | 5.3 |
Jul 30 2025 | 3.95 | -38.3 | -20.5 | 3.92 | 2.4 |
Sep 17 2025 | 3.76 | -57.0 | -18.7 | 3.78 | -1.9 |
Oct 29 2025 | 3.61 | -71.8 | -14.8 | 3.67 | -6.1 |
Dec 10 2025 | 3.45 | -87.8 | -16.0 | 3.55 | -9.8 |
Jan 28 2026 | 3.37 | -96.0 | -8.2 | 3.51 | -13.8 |
Mar 18 2026 | 3.28 | -105.1 | -9.1 | 3.45 | -16.9 |
Want to read more?
Find more articles and bullets on these widgets:
Historical bullets
AUDUSD TECHS: Approaching Key Resistance
- RES 4: 0.6429 High Dec 12 ‘24
- RES 3: 0.6414 38.2% retracement of the Sep 30 ‘24 - Feb 3 bear leg
- RES 2: 0.6409 High Feb 21 and a bull trigger
- RES 1: 0.6391 High Mar 17
- PRICE: 0.6359 @ 16:40 GMT Mar 18
- SUP 1: 0.6308 20-day EMA
- SUP 2: 0.6259/6187 Low Mar 11 / Low Feb 4
- SUP 3: 0.6171/6088 Low Feb 4 / 3 and a key support
- SUP 4: 0.6045 1.500 proj of the Sep 30 - Nov 6 - 7 price swing
A short-term bullish theme in AUDUSD remains intact and Monday’s gains reinforce this theme. Sights are on the key resistance at 0.6409, the Feb 21 high. Clearance of this hurdle would strengthen a bull cycle and confirm a resumption of the uptrend that started Feb 3. On the downside, a move below key short-term support at 0.6187, the Mar 4 low, is required to reinstate a bear threat. First support to watch is 0.6259, the Mar 11 low.
EURJPY TECHS: Impulsive Rally Extends
- RES 4: 165.43 High Nov 8
- RES 3: 164.90 High Dec 30 ‘24 and a key medium-term resistance
- RES 2: 164.55 High Jan 7
- RES 1: 164.19 High Mar 18
- PRICE: 163.46 @ 16:38 GMT Mar 18
- SUP 1: 161.50 Low Mar 17
- SUP 2: 159.96 50-day EMA
- SUP 3: 158.90 Low Mar 10
- SUP 4: 158.00 Round number support
A bull cycle in EURJPY remains in play and this week’s extension and positive start to the week, reinforces current conditions. The contract again traded higher Tuesday and cleared resistance at 164.08, the Jan 24 high. This strengthens the bullish condition and opens 164.90, the Dec 30 ‘24 high. The bull cycle is overbought, a pullback would allow this condition to unwind. Firm support lies at 159.96, the 50-day EMA.
FED: Longer-Run Dot To Rise Again (2/2)
2026-27: 2026 is also likely to maintain its implied 2 cut dot of 3.4%, though there are salient two-way risks here: just 5 participants in December saw that level of year-end rates, with 7 above and 7 below. The risks here lean hawkish and it’s possible 3 dots move above 3.4% to raise the median to 3.6% (one cut), but this isn’t MNI’s base case. However, as with 2025’s, the lower dots (3x between 2.4% and 2.9%) could shift higher, and it’s possible there is a slight rise in the number of dots at the high end (3.9%), with potential for the top participant’s dot to exceed that.
- For 2027, most participants appear to simply consider this an extension of the longer-run dot, with 7 of 19 participants at the median 3.1% last time, just above the 3.0% longer-run dot. While the latter may shift up (see below) due to upward movements in a few dots, the distribution for 2027 would require far more participants to shift their view from the last meeting to move the median (there were 12 participants at 3.1% or below).
Longer-Run: The longer-run dot median has shifted up in each quarterly projection so far since the start of 2024, to 2.625% in March, to 2.75% in June, to 2.875% in September, and to 3.00% in December. An increase in the median to 3.125% in March would thus be in keeping with the trend and we tentatively pencil it in.
- At last count in December, there were 8 dots below 3.00%, 3 at 3.00%, and 8 above. So to move the median to 3.125%, it would require 2 of the 11 dots to move from 3.00% or below to move to 3.125% or above. That’s a slightly higher bar than at the prior meeting (only 1 dot shift was required), but certainly surmountable, and the chances are probably 50/50.
- Such an increase would bring it back above 3.00% for the first time since March 2016, and would be up from the trough of 2.40% in 2022.
