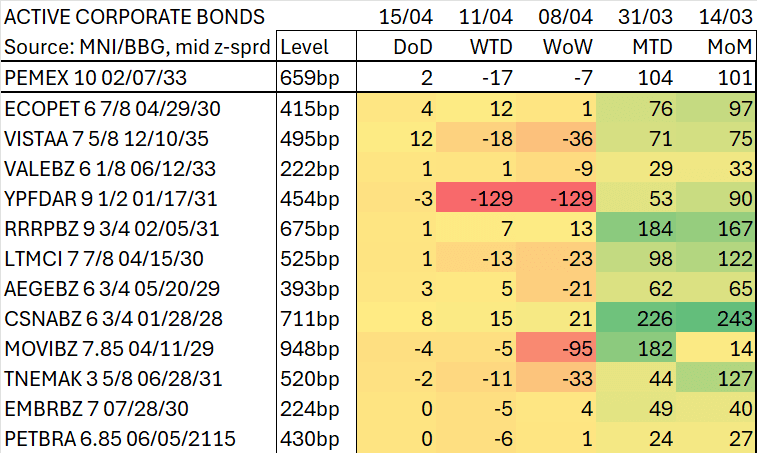
EM LATAM CREDIT: EM LATAM ACTIVE CORPORATE BONDS SPREAD MOVEMENTS
Observations (Derived from Table Shown Below Bullets)
• Argentina’s YPF (YPFDAR) moving in line with the sovereign post IMF deal and FX regime changes.
• Mexican auto parts Nemak (TNEMAK) recovering a bit from US tariff driven sell off.
• Colombia controlled Ecopetrol (ECOPET) widening with new sovereign supply yesterday.
• Argentina O&G Vista Energy (VISTAA) widening. USD1.5bn acquisition with USD900mn upfront means likely new issuance to fund the deal. Fundamentally positive acquisition.
• Brazil’s Brava Energia (RRRPBZ) not recovering yet from oil price induced widening this month.
• Brazil’s CSN (CSNABZ) underperforming, possibly due to weaker global economic outlook and lower iron ore and steel prices with the stock about 10% lower MTD.
Want to read more?
Find more articles and bullets on these widgets:
Historical bullets
CHF: FX Exchange traded Option
CHFUSD (9th May) 112.00p sold at 0.28 in 1k.
US DATA: Rising Costs And Uncertainty Hurt Homebuilder Sentiment
The National Association of Home Builders (NAHB)/Wells Fargo Housing Market Index (HMI) fell to a joint 15-month low in March at 39, vs expectations it would remain steady at 42, in another piece of "soft" data that suggests tariffs and other policy shifts - plus uncertainty itself - are having a net stagflationary effect at least in the short term.
- "Present sales" fell 3 points to 43, a 15-month low and the second straight sharp decline since the recent peak of 50 in January, while prospective buyer traffic dropped 5 points to 24, a joint 16-month low and also down sharply from the post-election peak 32.
- While "future sales" were steady at 47, that was still a joint 9-month low.
- And sentiment fell across all 4 U.S. regions for a 2nd consecutive month.
- The main culprit was rising prices, per the report's authors: “Builders continue to face elevated building material costs that are exacerbated by tariff issues, as well as other supply-side challenges that include labor and lot shortages" though "builders are starting to see relief on the regulatory front to bend the rising cost curve". And "construction firms are facing added cost pressures from tariffs" with "data from the HMI March survey reveals that builders estimate a typical cost effect from recent tariff actions at $9,200 per home. Uncertainty on policy is also having a negative impact on home buyers and development decisions.”
- The renewed softness in sentiment suggests that the ongoing rebound ing residential construction is likely to be subdued.


US DATA: Weakness In Restaurant Sales Adds To Evidence Of Softening Demand
We wanted to highlight again February's softness in the "food services/drinking places" retail sales category, which is another piece of evidence that household demand is waning after an extraordinarily strong post-pandemic period. After falling by 1.5% M/M in February (the most in 24 months), the rate of growth in this category on a Y/Y adjusted basis is down to 1.5% - the softest since February 2021.
- Some of the decline is of course inflation related - the Y/Y SA rate of food away from home in CPI was 3.6% in February, vs 8+% in early 2023. But even when deflating by CPI food away from home, this was the joint-weakest (Jan 2024 ) "real" restaurant/bar Y/Y spending since 2010 (ex-pandemic)
- And while we saw some analysts citing weather conditions for the softness, the trends in Y/Y growth can't be attributed simply to one-off or seasonal effects. The category was growing comfortably in the double digits Y/Y through 2023 as one of the most conspicuous areas of pent-up spending amid the pandemic reopening, but demand for this most discretionary category of retail consumption is clearly waning. For perspective, it averaged 6% Y/Y monthly in the 5 years before the pandemic.
- It also chimes with some "soft" indicators that have been making the rounds, including on vacation spending plans (per Conference Board, 15-year low ex-pandemic), amid overall consumer uncertainty.
- This is the only services category in the retail sales data, and the 3rd largest retail sales category overall (and is excluded from Control Group sales, which were solid in February). Recall that goods PCE was the main driving force behind the pickup in overall PCE late last year (growing 6.1% in Q4), with services solid but relatively tame (growing 3.3% in Q4). Services make up 69% of PCE, goods 31%, so a slowdown in services demand would be particularly worrying for growth.
- Motor vehicle sales/parts sales - the largest single retail category (autos alone are excluded from Control Group)- are coming back to earth as well after a strong post-summer rebound, falling M/M the last two months and now rising at 3.1% Y/Y vs 8.7% just two months prior.
- The main positive point from the big 3 retail categories is non-store (ie e-commerce) retailers, the second-largest retail category, which was one of the bright spots in the February reading as sales rebounded 2.4% after -2.4%. On a Y/Y basis, while rebounding to 6.5% from 3.7% prior for a 3-month high, this is still overall trending lower.
- These three categories are 50% of retail sales, so will dictate the tempo going forward.
